This topic contains a solution. Click here to go to the answer
|
|
|

 Cross Section of the Left Breast
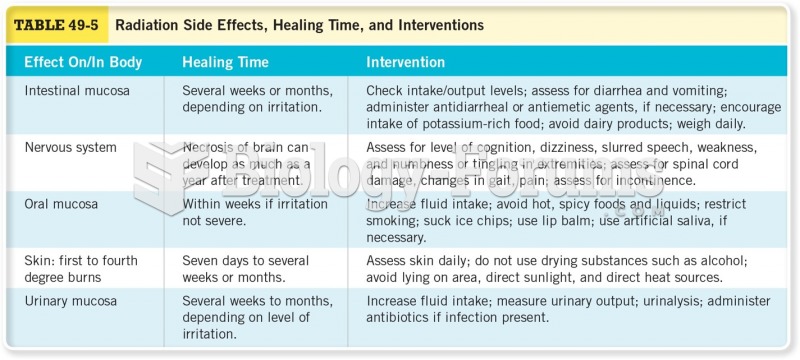 Radiation Side Effects, Healing Time, and Intervention
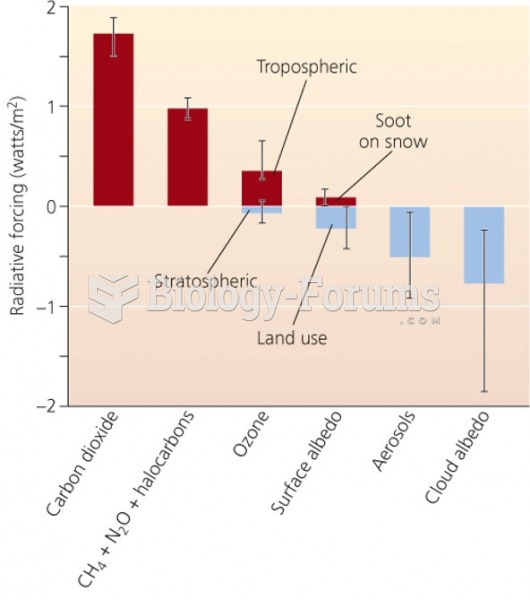 Radiative forcing expresses change in energy input over time
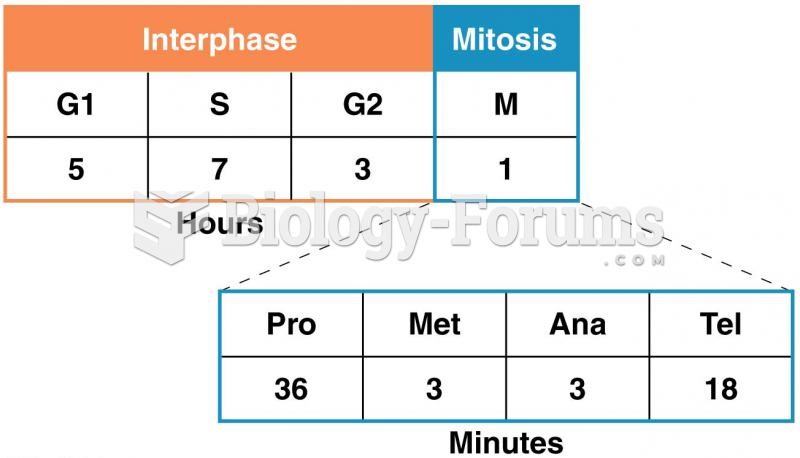 The time spent in each interval of one complete cell cycle of a human cell in culture
 economic question