|
|
|

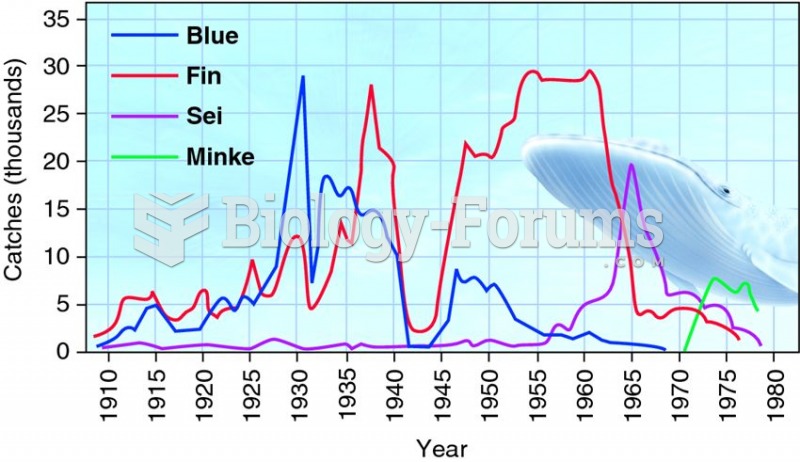 Sequential decline of whale catches in the Antarctic shows the strong effect of human predators.
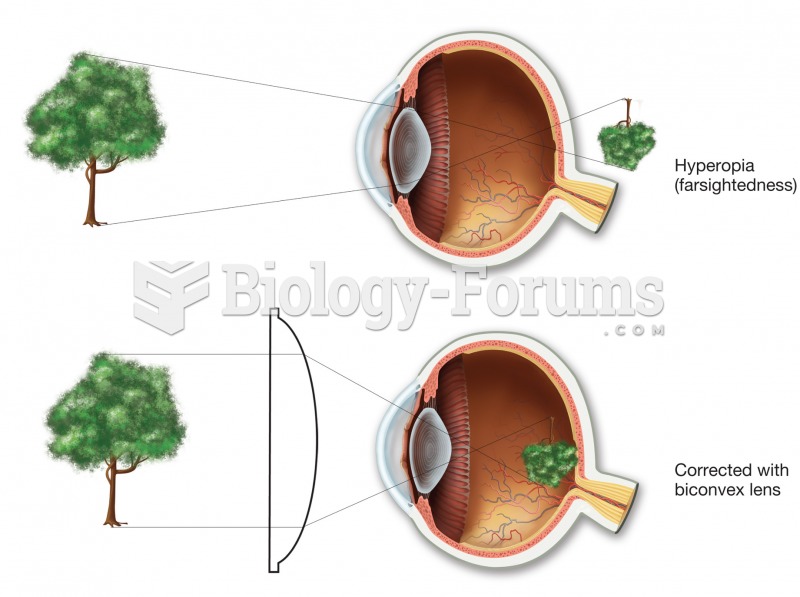 Hyperopia (farsightedness). In the uncorrected top figure, the image would come into focus behind th
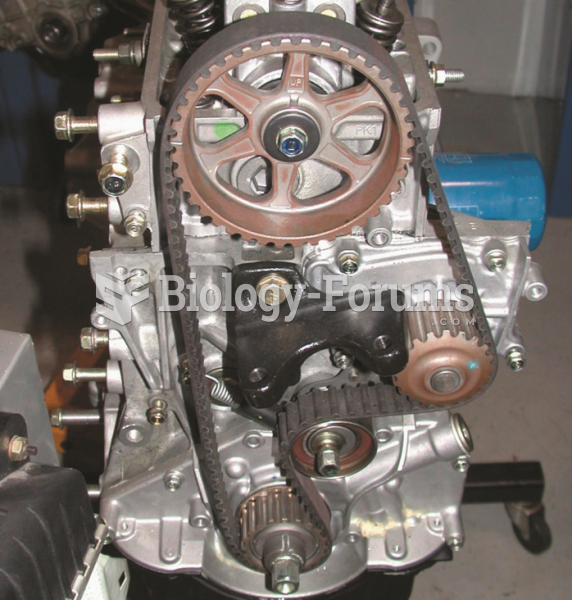 A single overhead camshaft engine with a timing belt that also rotates the water pump.
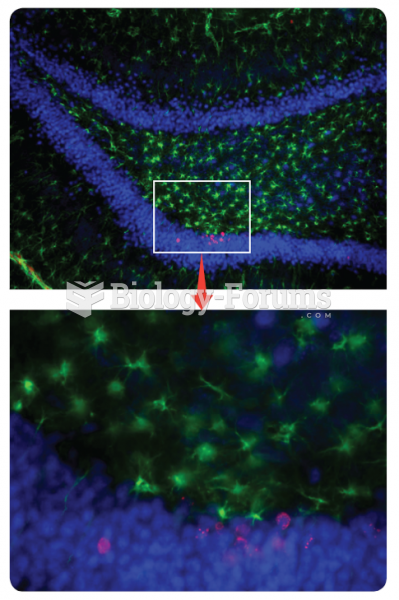 Adult neurogenesis. The top panel shows new cells in the dentate gyrus of the hippocampus—the cell ...
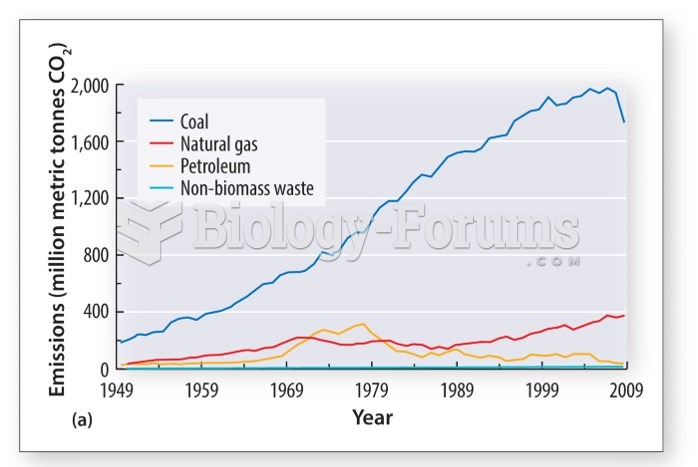 The demand for cheap coal to generate electrical power is rising
 Which of the following reactions correctly shows the transmutation of an element by neutron ...