|
|
|

 From space earth shows itself as a planet covered mostly by water.
 A nurse shows empathy to a client.
 Children can fast map the meanings of words in a single exposure.
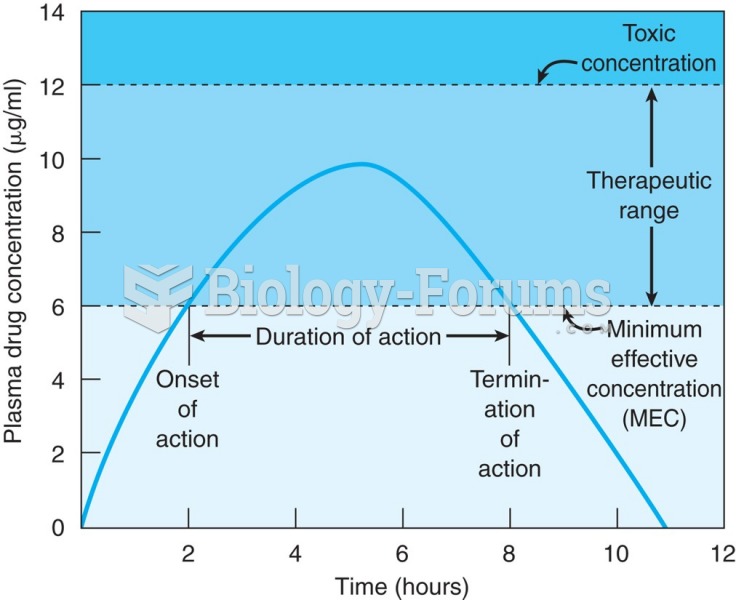 Graph showing oral administration of a single-dose drug. The time of onset is 2 hours and the end of ...
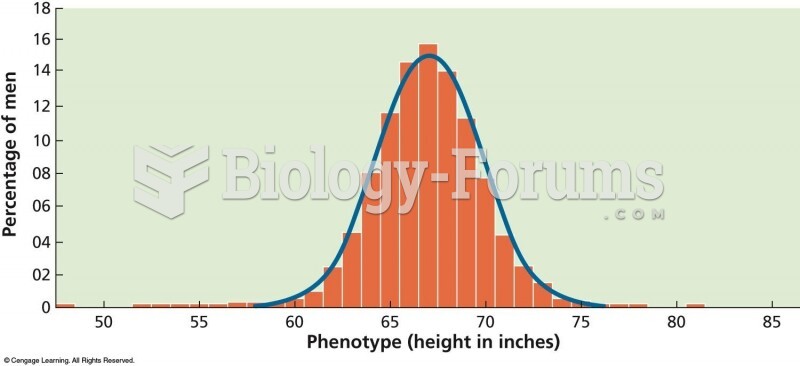 A bell-shaped, or “normal,” curve shows the distribution of phenotypes for traits controlled by ...
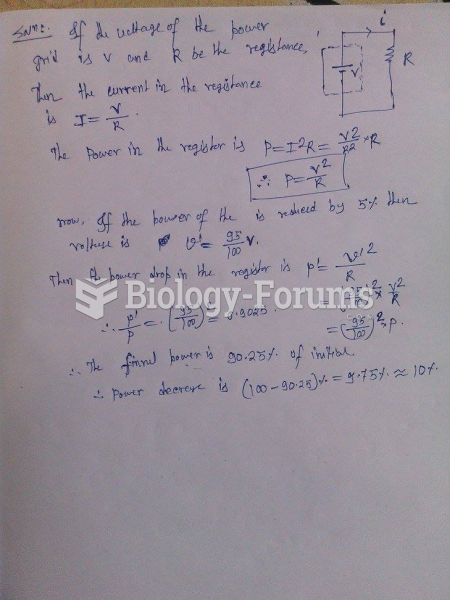 During a period of high power demand, the voltage output of the power company is reduced by ...