|
|
|

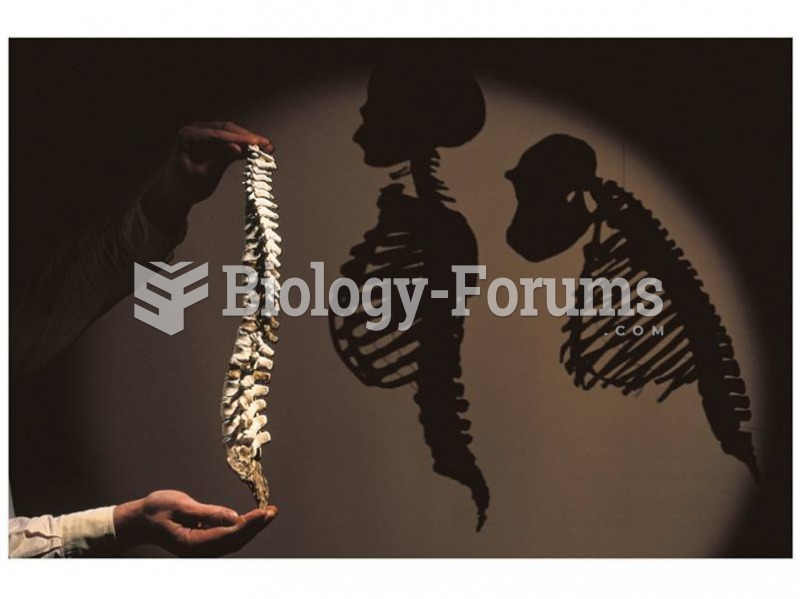 Reconstructed Australopithecus afarensis spine shows that species walked upright.
 Treatment of Depression with Ketamine The graph shows the effects of ketamine on symptoms of depress
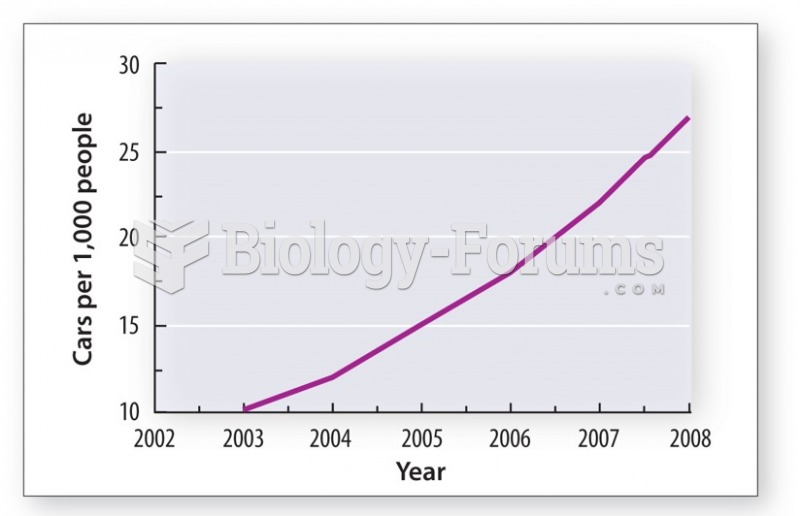 The growth in demand for oil in China is driven by the growth in demand for personal transport
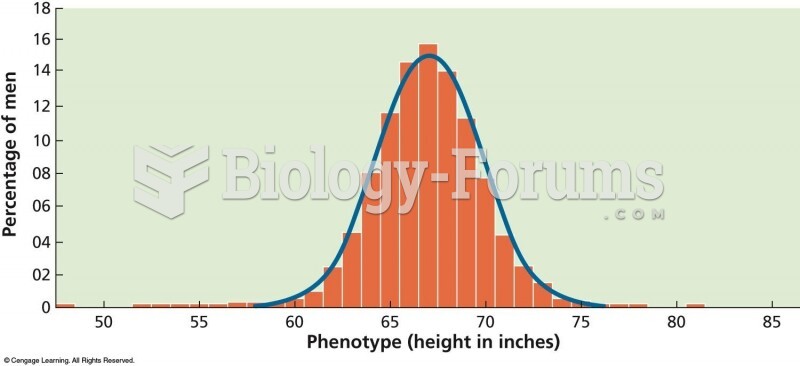 A bell-shaped, or “normal,” curve shows the distribution of phenotypes for traits controlled by ...
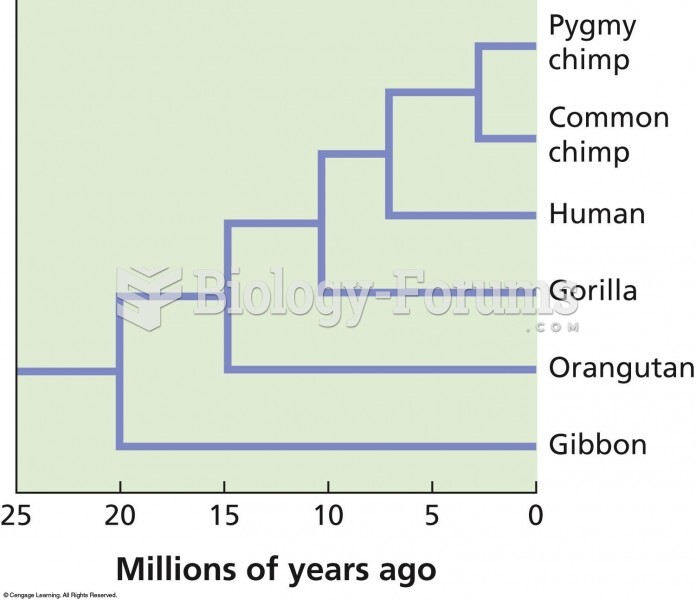 A phylogenetic tree showing the evolutionary relationships among hominoids. The evidence shows that
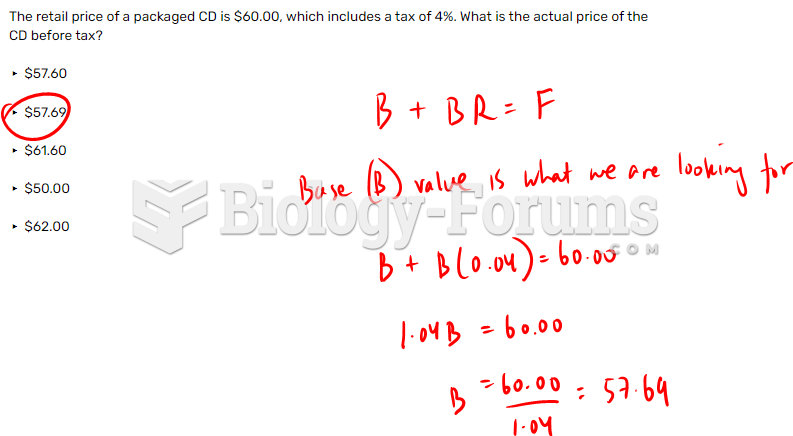 The retail price of a packaged CD is $60.00, which includes a tax of 4%. What is the actual ...