|
|
|

 In this cartoon, Boss Tweed welcomes cholera—a skeletal figure of death carrying a handbag from “Asi
 Single- and Double-Blind Procedures
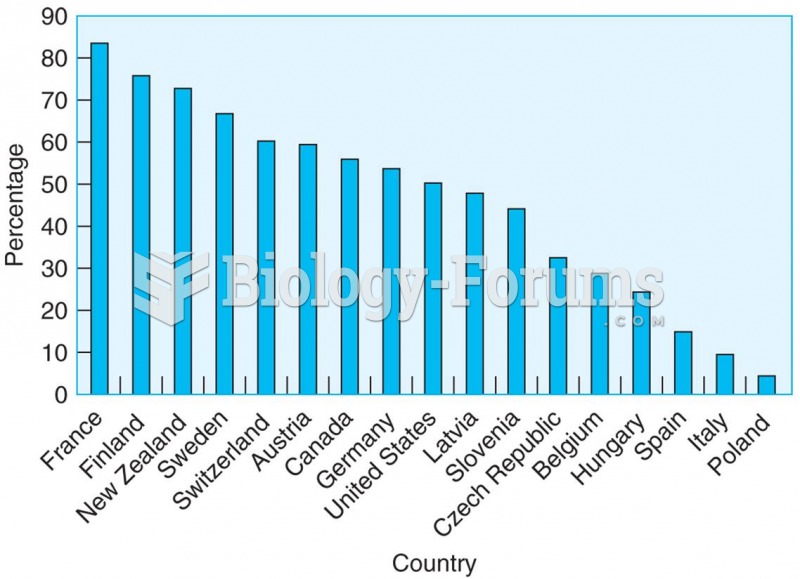 The percentage of women who have cohabited by the age of 45 for 17 countries shows that the ...
 The growth in demand for energy use is met by burning fossil fuels
 This table shows the growth of a crowd at a rally over a 3 h period.
 The structural genes of the lac operon are transcribed into a single polycistronic mRNA