Did you know?
The effects of organophosphate poisoning are referred to by using the abbreviations “SLUD” or “SLUDGE,” It stands for: salivation, lacrimation, urination, defecation, GI upset, and emesis.
Did you know?
Individuals are never “cured” of addictions. Instead, they learn how to manage their disease to lead healthy, balanced lives.
Did you know?
Tobacco depletes the body of vitamins A, C, and E, which can result in any of the following: dry hair, dry skin, dry eyes, poor growth, night blindness, abscesses, insomnia, fatigue, reproductive system problems, sinusitis, pneumonia, frequent respiratory problems, skin disorders, weight loss, rickets, osteomalacia, nervousness, muscle spasms, leg cramps, extremity numbness, bone malformations, decayed teeth, difficulty in walking, irritability, restlessness, profuse sweating, increased uric acid (gout), joint damage, damaged red blood cells, destruction of nerves, infertility, miscarriage, and many types of cancer.
Did you know?
A strange skin disease referred to as Morgellons has occurred in the southern United States and in California. Symptoms include slowly healing sores, joint pain, persistent fatigue, and a sensation of things crawling through the skin. Another symptom is strange-looking, threadlike extrusions coming out of the skin.

 Myopia (nearsightedness). In the uncorrected top figure, the image comes into focus in front of the
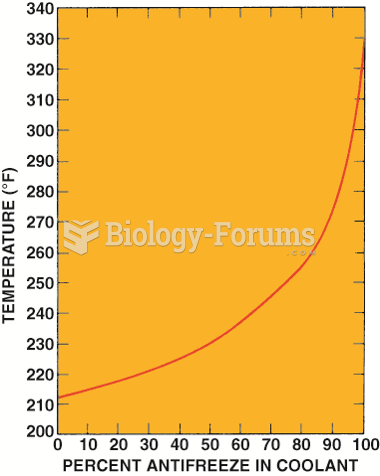 Graph showing how the boiling point of the coolant increases as the percentage of antifreeze in ...
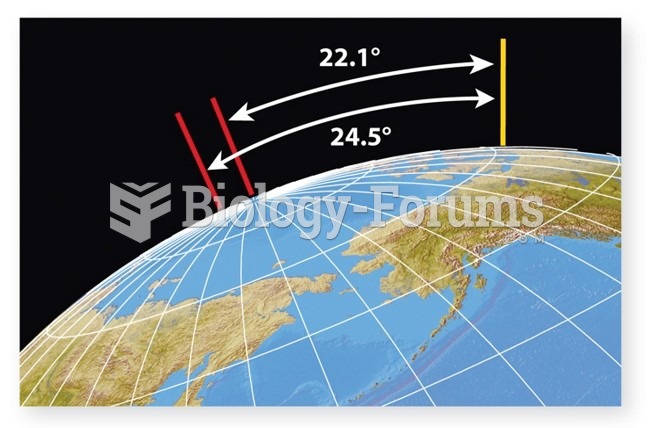 Obliquity "Tilt of Earth on its axis"
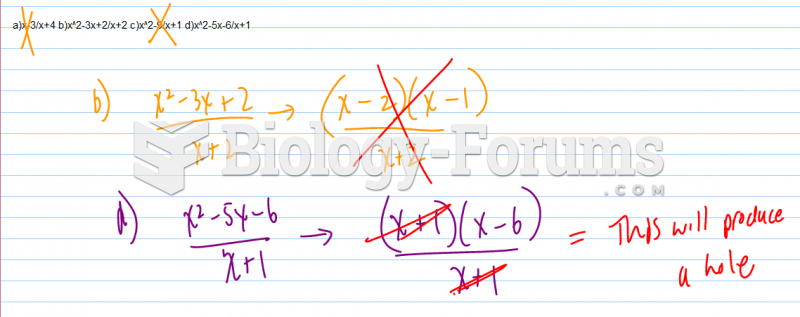 As a result of a hole in the graph, which of the following functions does not have an average ...
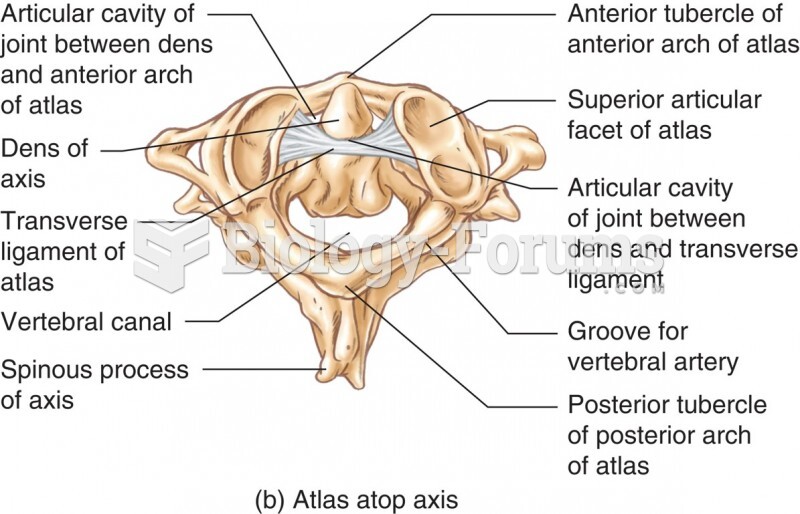 The Atlas Seated on the Axis
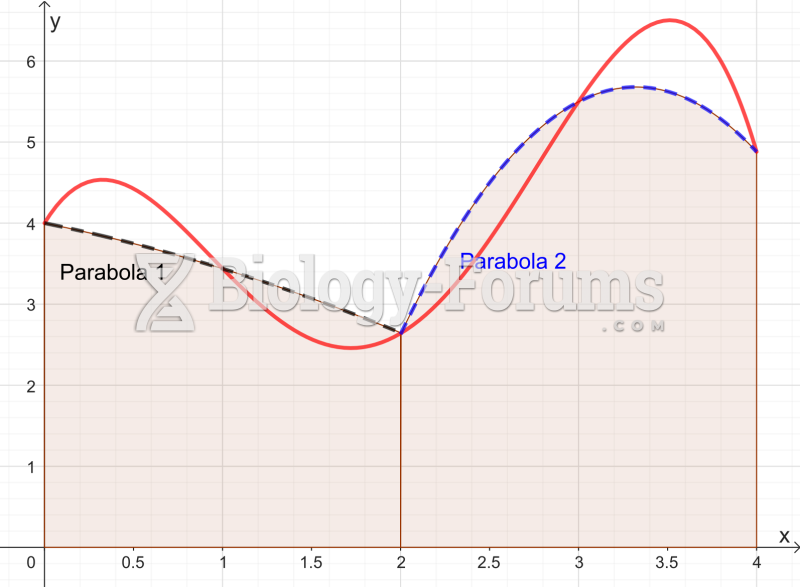 Graph approximated by two parabolas for the Simpson's rule