This topic contains a solution. Click here to go to the answer
|
|
|

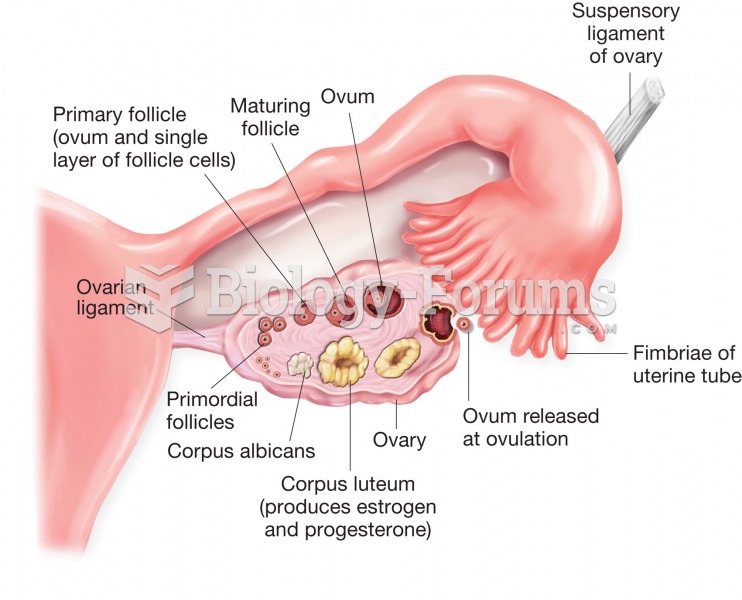 Structure of the ovary and uterine (fallopian) tube. Figure illustrates stages of ovum development a
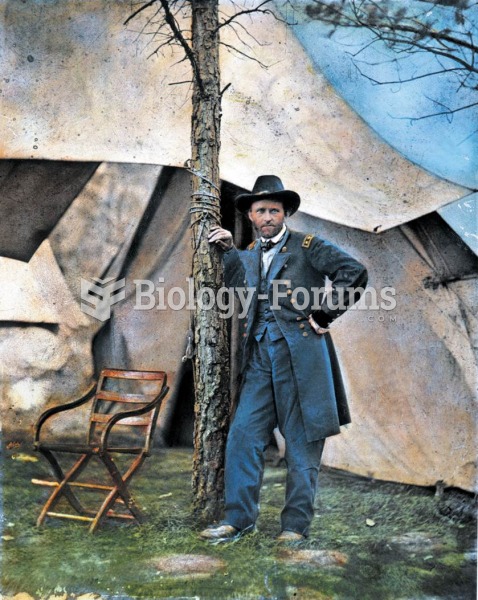 Ulysses S. Grant poses at City Point, Virginia, during the siege of Petersburg.
 POWER POINT PRESENTATION logo
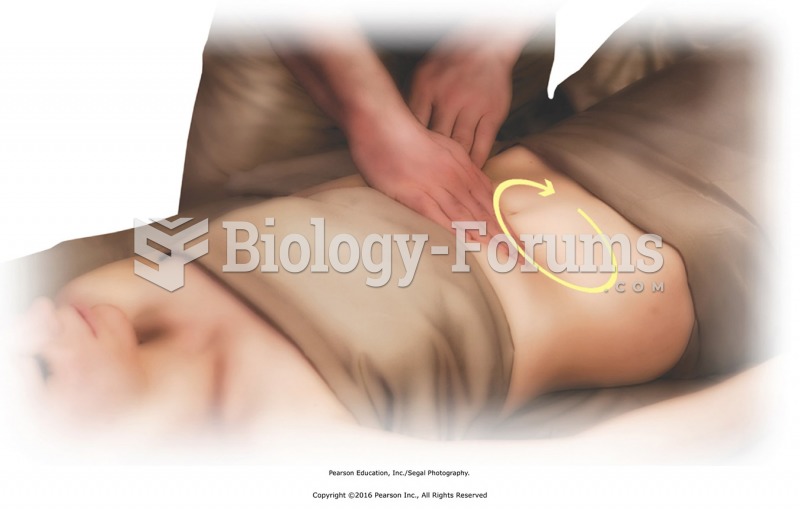 With your fingertips, using medium pressure, trace the colon over the abdomen. Move in clockwise ...
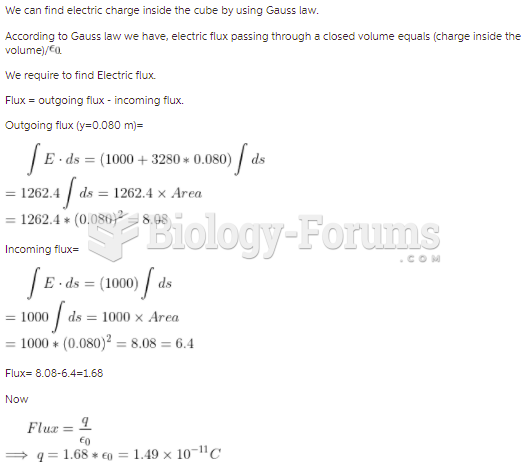 The cube of insulating material shown in the figure has one corner at the origin. Each side of ...
 The hypothalamic–pituitary–adrenal axis