|
|
|

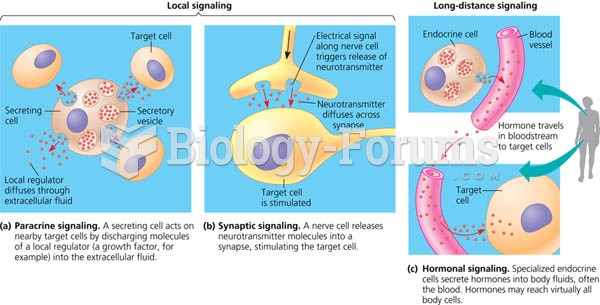 Local and long–distance cell communication in animals.
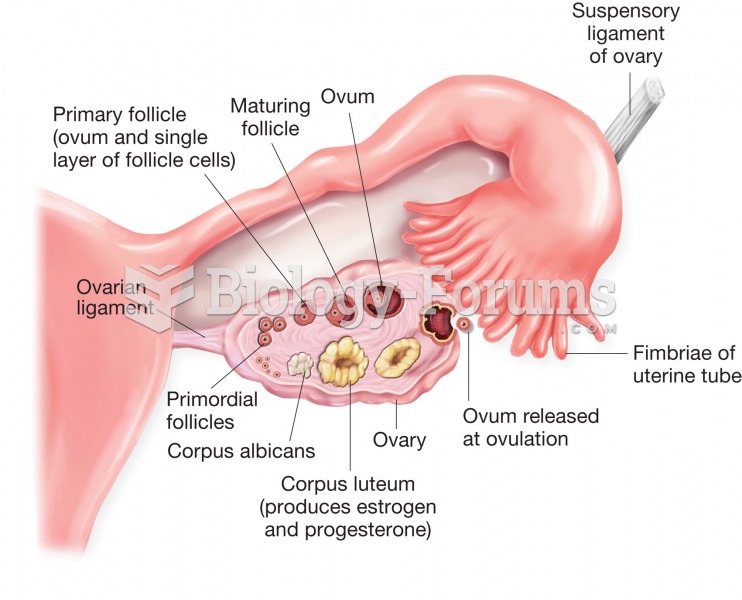 Structure of the ovary and uterine (fallopian) tube. Figure illustrates stages of ovum development a
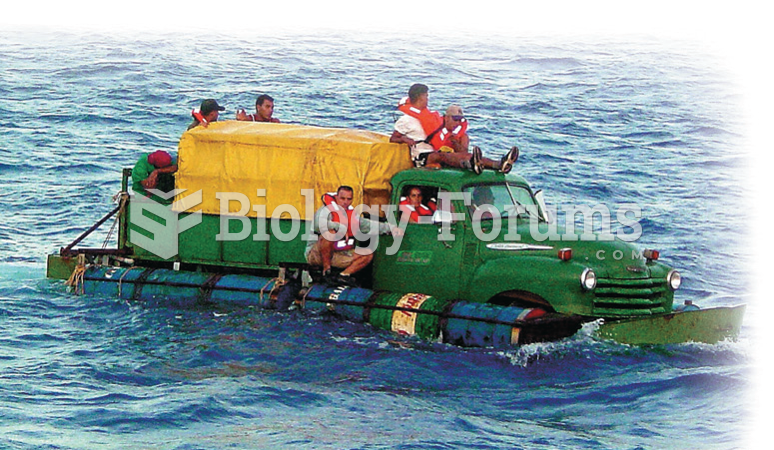 For millions of people, the United States represents a land of opportunity and freedom from ...
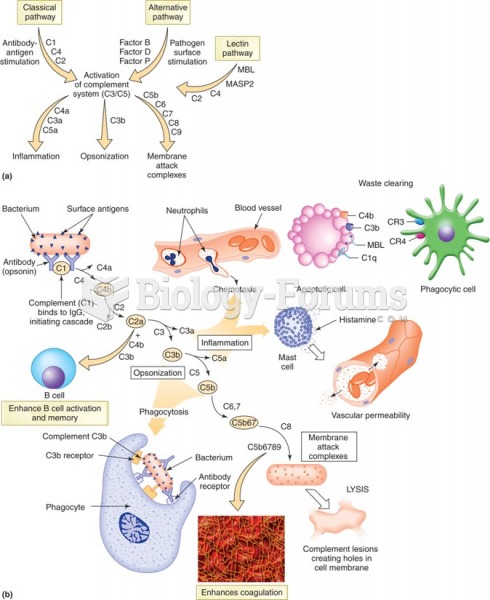 Three pathways of complement combined. (a) Figure shows a summary of how each pathway proceeds. (b) ...
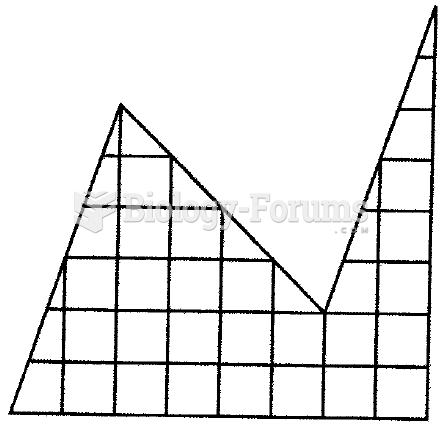 Cut the figure into two identical parts
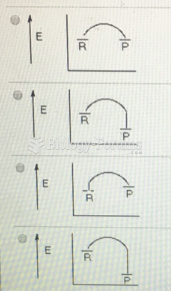 Which of the following represents a reaction coordinate diagram for a chemical reaction whose ...