|
|
|

 Hip Typically occurs as a result of a fall; with osteoporosis, hip fractures can occur as a result o
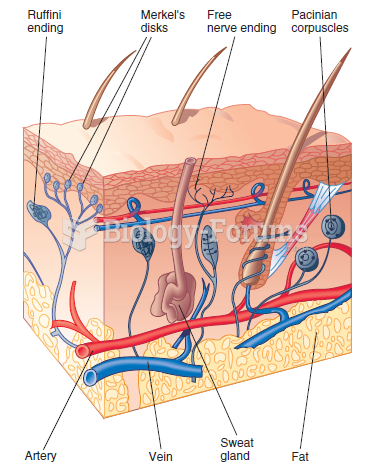 Four cutaneous receptors that occur in human skin.
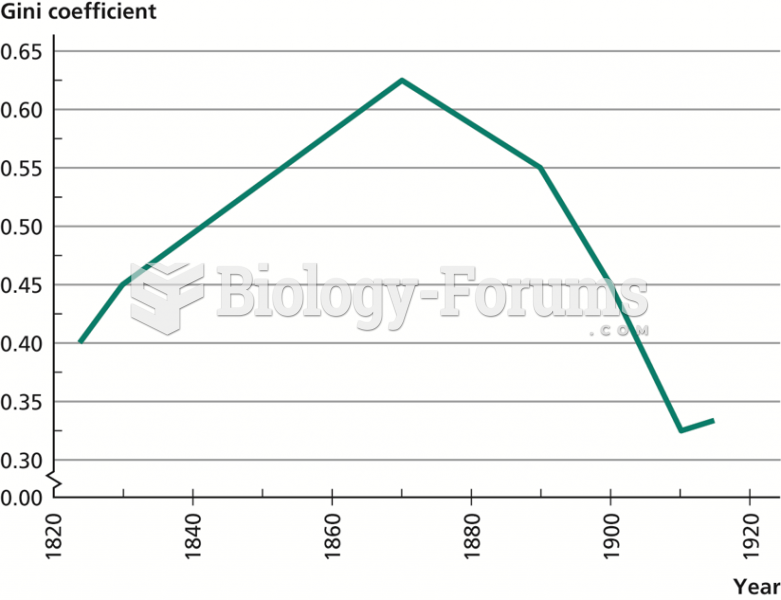 The Kuznets Curve in England and Wales, 1823–1915
 Punnett square of the dihybrid cross shown in Figure 3.8. There are two combinations of dominant and
 What is the current in Figure 16-1(b) if the diode is made of silicon and the polarity of the ...
 The age-of-onset curve for Huntington disease (HD)