|
|
|

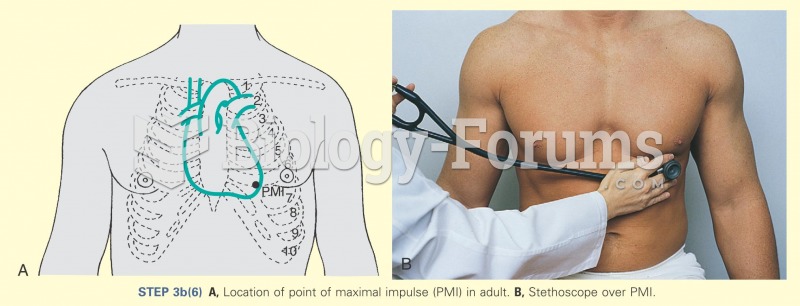 Location of point of maximum effort
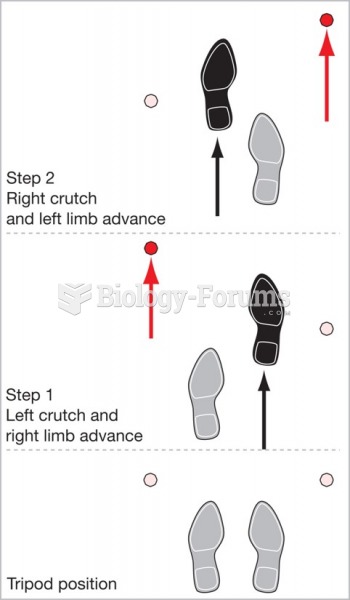 Two-point gait.
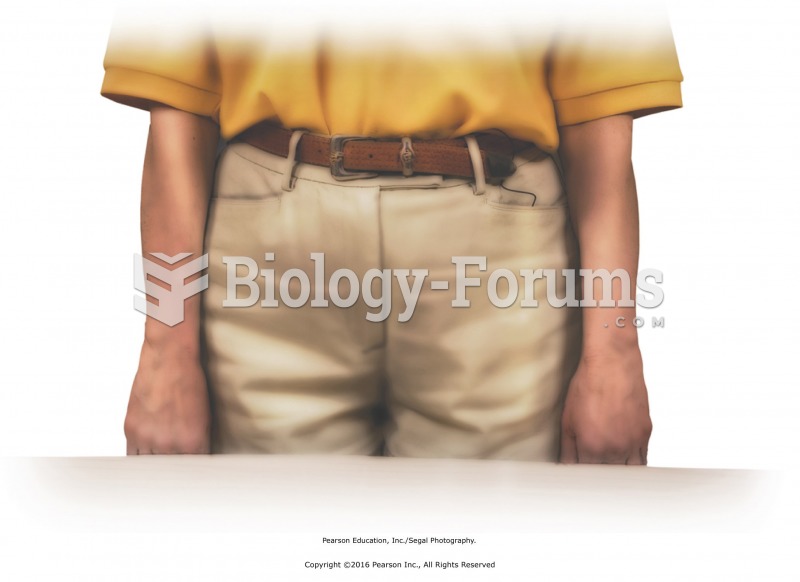 Determining a good table height. Stand facing the table with your hands at your sides. Adjust the ...
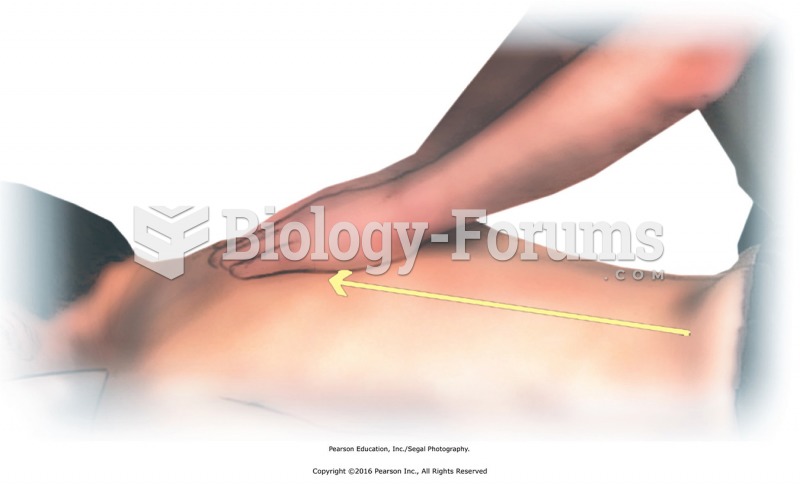 Effleurage to the entire back to apply oil. Stand at the side of the table near the recipient’s ...
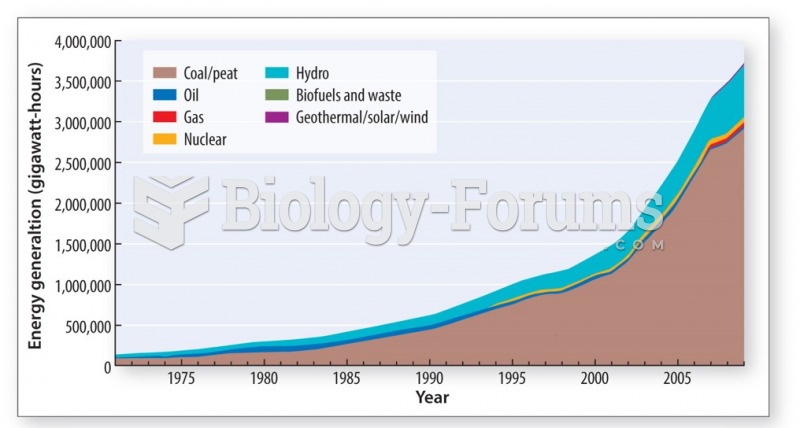 China has relied on cheap coal to meet its demand for energy
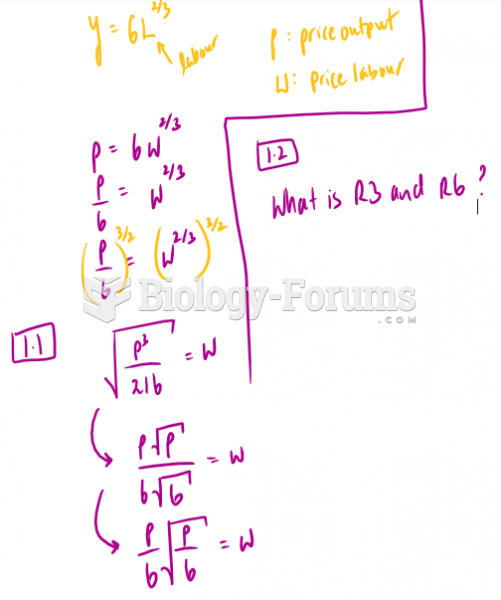 Find the factor demand for labour and the amount of output it will produce. Show all ...