|
|
|

 Blank periodic table
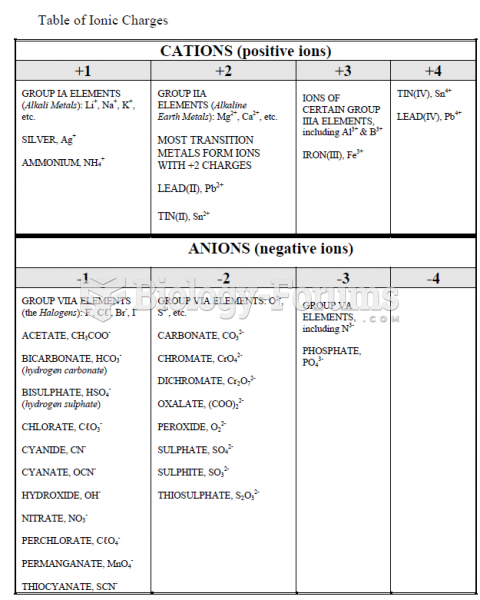 Table of Ionic Charges
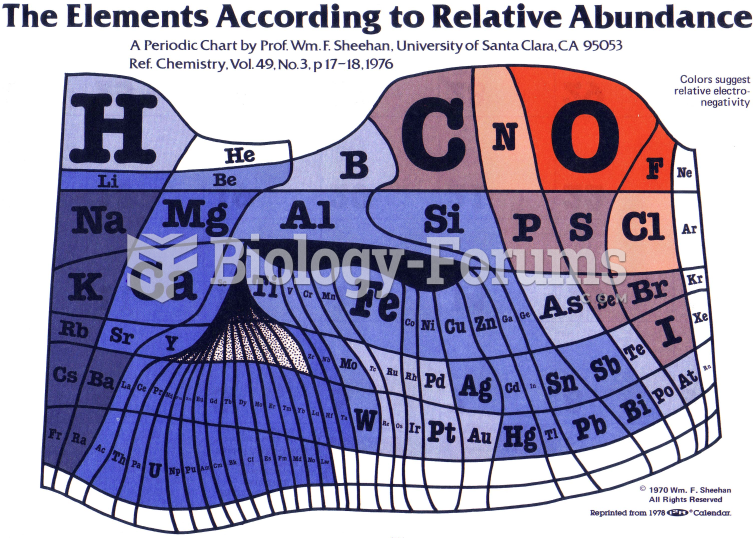 Periodic Table
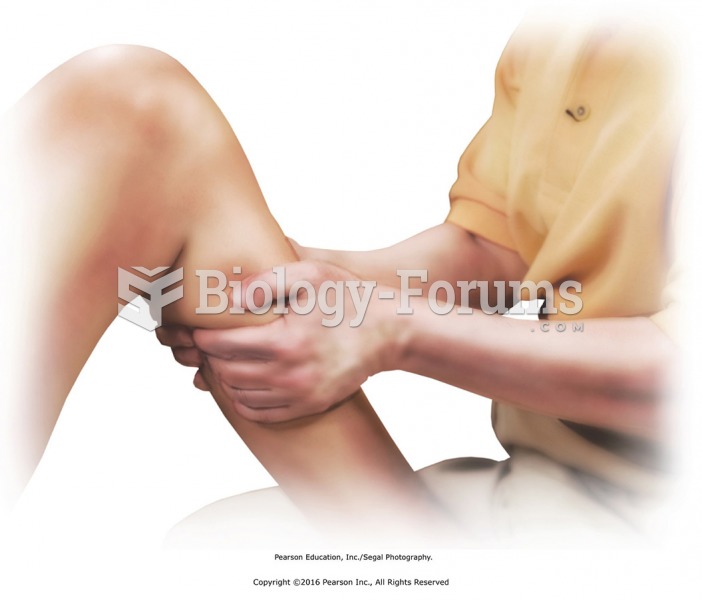 Knead the calf muscles with both hands. Place the foot flat on the table, knee bent. Reach behind ...
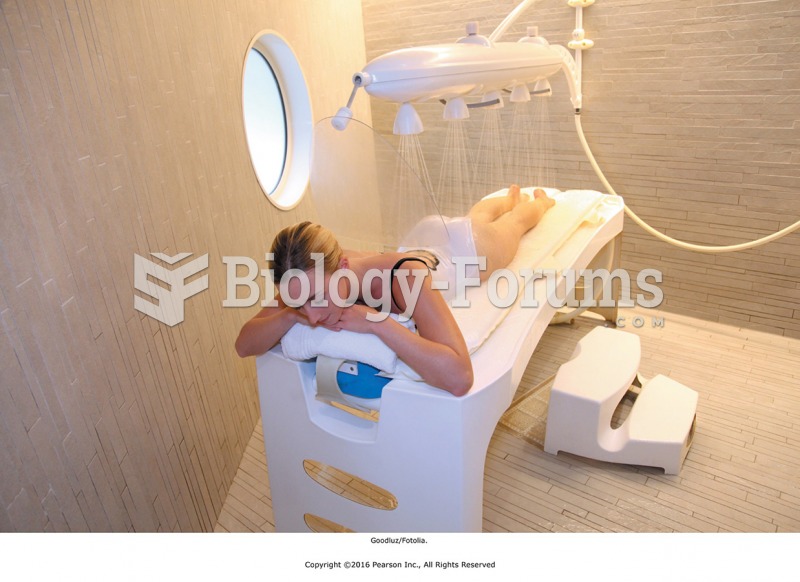 Wet table and Vichy shower in a wet room.
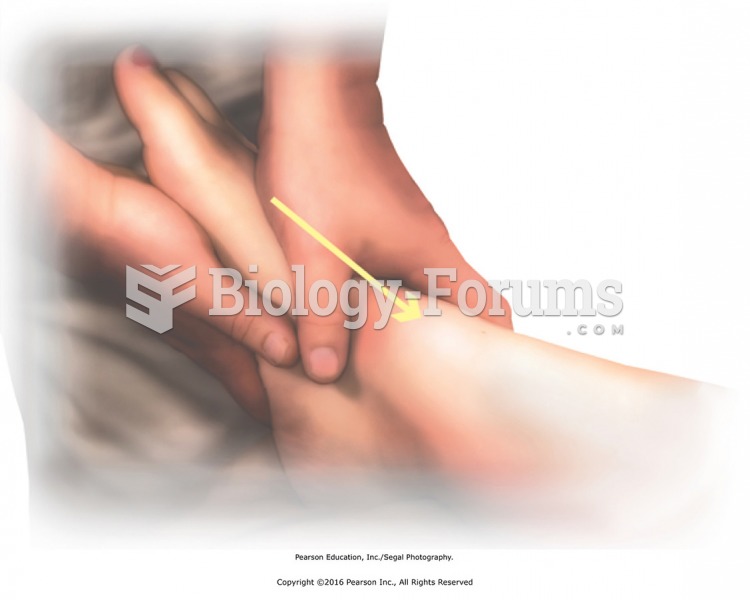 Clear the tarsals, metatarsals, and toes. Stand at the end of the table, support the plantar surface ...