|
|
|

 Finger pressure to a trigger point.
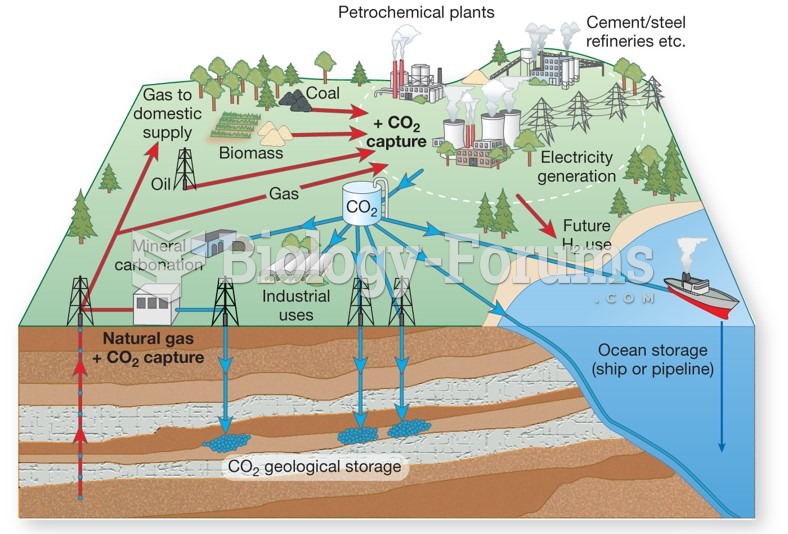 The growing demand for electrical power, carbon sequestration and storage must be a priority
 Set-Point Theory
 A 0.51 m aqueous solution of an unknown solute has a boiling point elevation of 0.62°C. The ...
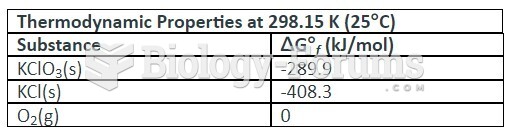 table
table
 Summary of the effects on transcription levels of different point mutations