This topic contains a solution. Click here to go to the answer
|
|
|

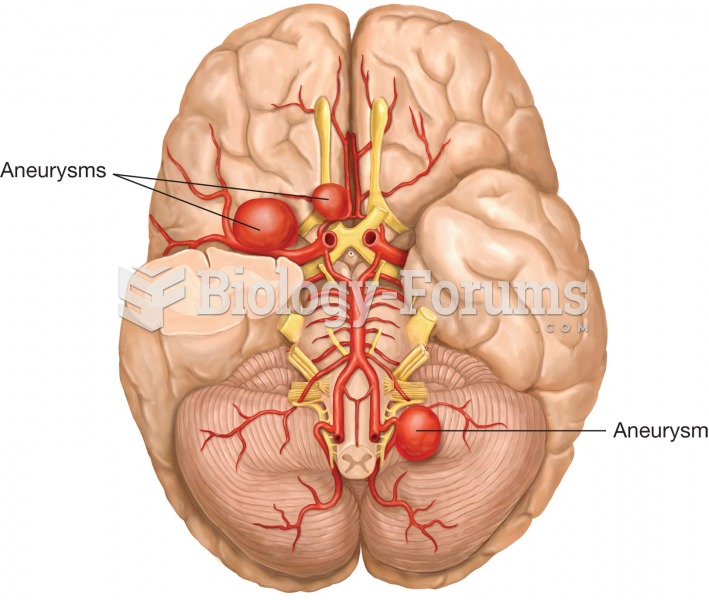 Cerebral aneurysm. A cerebral aneurysm is the abnormal dilation of arteries supplying the brain, whi
 The paleoanthropologist must understand these deformations in order to figure out which strata a fos
 This label on a Toyota Camry hybrid shows the relative smog-producing emissions, but this does not ...
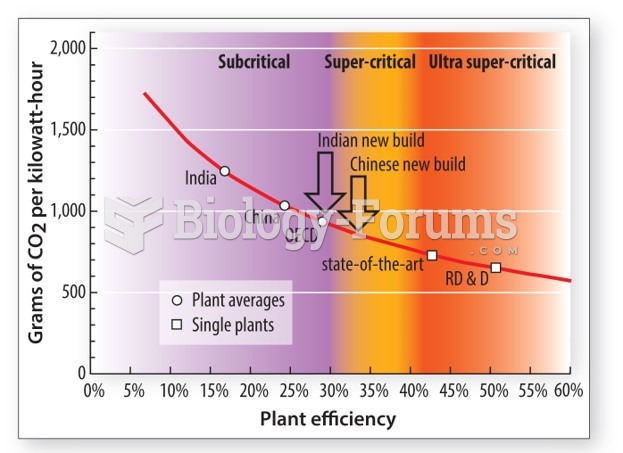 The production of electricity from coal is inefficient
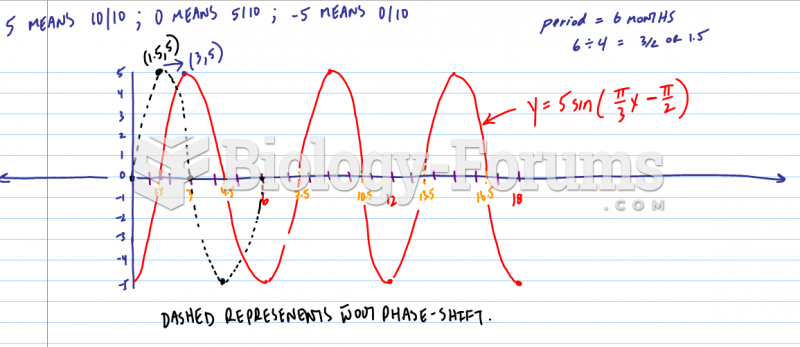 Sketch a graph of the function h(x), by hand on the following interval:
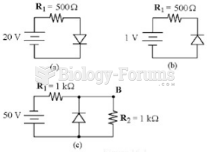 What is the current in Figure 16-1(b) if the diode is made of silicon and the polarity of the ...