Refer to the figure above. Which indifference curve depicts the highest level of utility?
A) IC1
B) IC2
C) IC3
D) IC4
Question 2
Suppose the government establishes a price support for soybeans. The new government program will tend to
A) decrease the output of soybeans.
B) increase the quantity demanded of soybeans.
C) decrease the demand for soybeans.
D) increase a farmer's opportunity cost of producing other commodities (such as corn), which could be grown on the same land used to grow soybeans.
E) do none of the above.

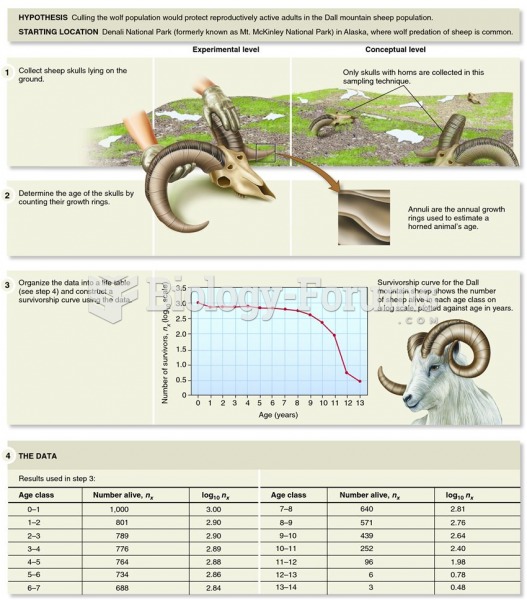 Examining the survivorship curve of a Dall mountain sheep population reveals information on the caus
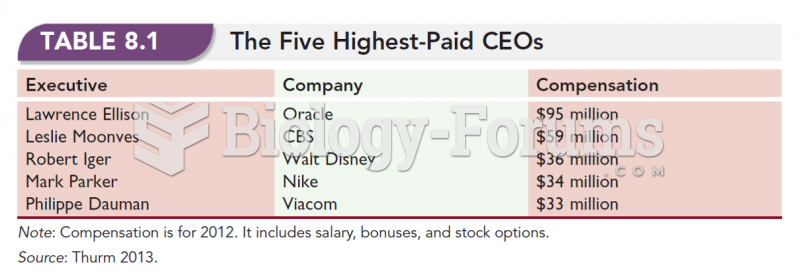 The Five-Highest Paid CEOs
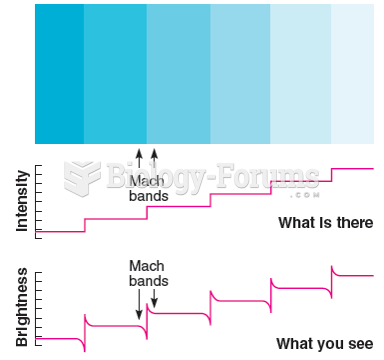 The illusory bands visible in this figure are often called Mach bands, although Mach used a ...
 Higher-Level Thinking Skills Used in Massage Therapy
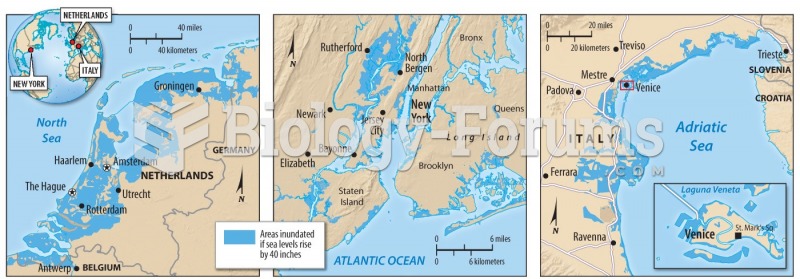 Rising sea level: Some areas will be affected by a rise of just 40 cm
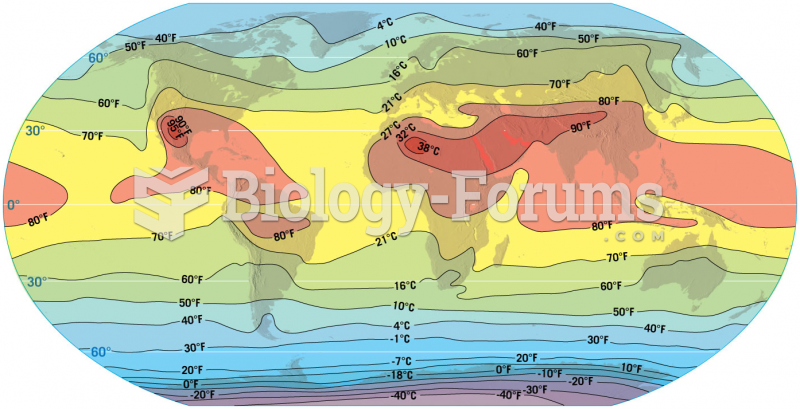 World Mean Sea-Level Temperatures in July