Refer to the figure above. Which indifference curve depicts the highest level of utility?
A) IC1
B) IC2
C) IC3
D) IC4
Question 2
Suppose the government establishes a price support for soybeans. The new government program will tend to
A) decrease the output of soybeans.
B) increase the quantity demanded of soybeans.
C) decrease the demand for soybeans.
D) increase a farmer's opportunity cost of producing other commodities (such as corn), which could be grown on the same land used to grow soybeans.
E) do none of the above.

 Testing Visual Fields by Confrontation: The nurse and patient should be approximately at an eye to e
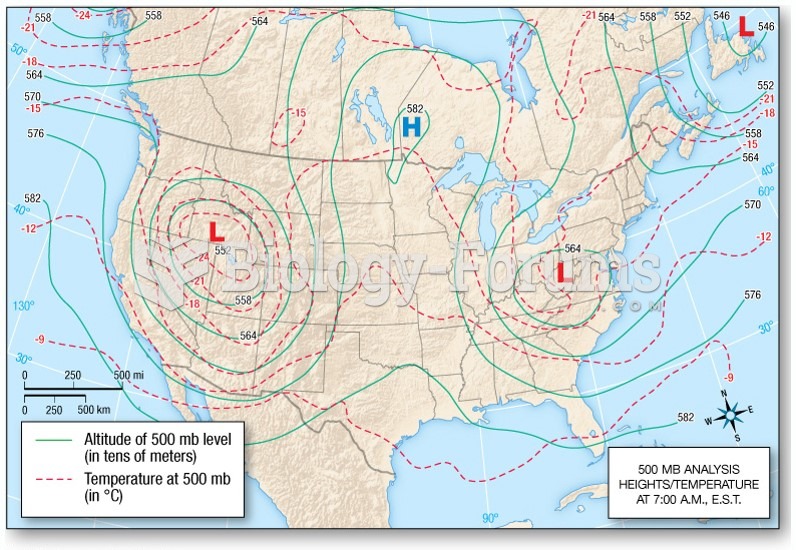 Upper-Level Maps
 How to find the equation of a cosine curve
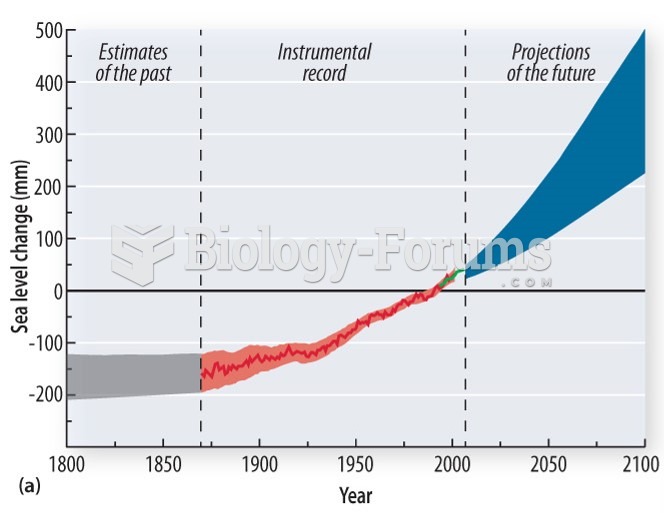 The IPCC projects sea level rise
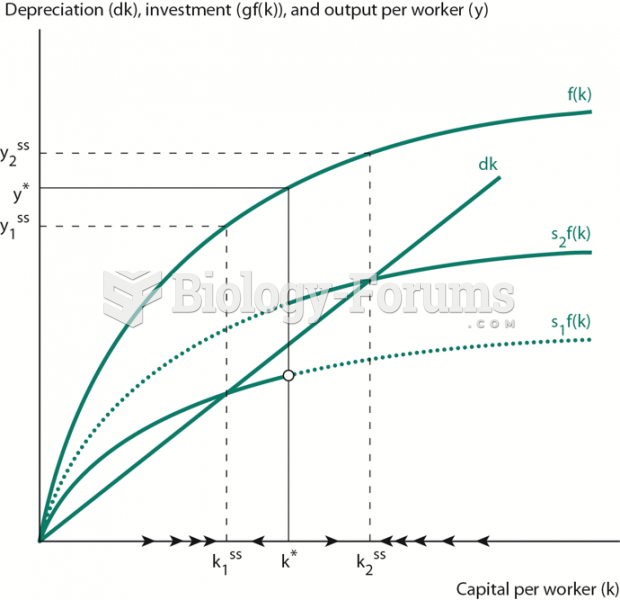 Solow Model with Saving Dependent on Income Level
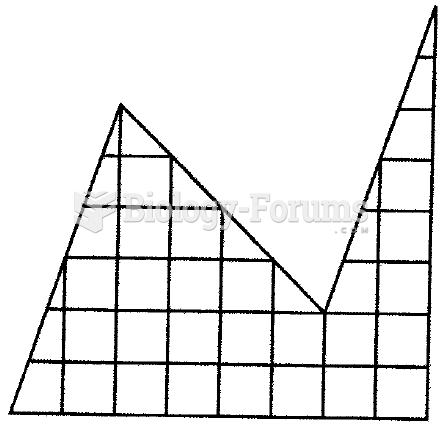 Cut the figure into two identical parts