Refer to the figure above. Which indifference curve depicts the highest level of utility?
A) IC1
B) IC2
C) IC3
D) IC4
Question 2
Suppose the government establishes a price support for soybeans. The new government program will tend to
A) decrease the output of soybeans.
B) increase the quantity demanded of soybeans.
C) decrease the demand for soybeans.
D) increase a farmer's opportunity cost of producing other commodities (such as corn), which could be grown on the same land used to grow soybeans.
E) do none of the above.

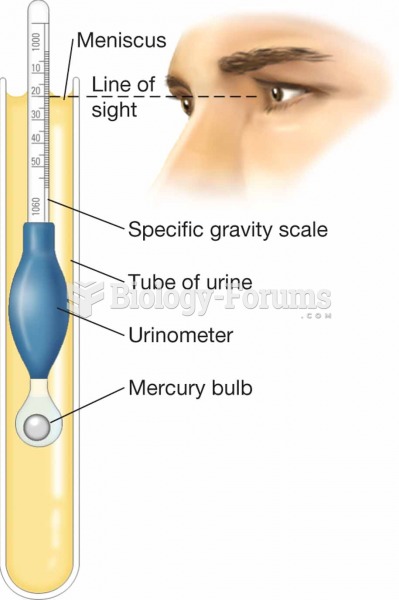 Urinometer. In this procedure, a urine sample and urinometer are placed within a tube, and the liqui
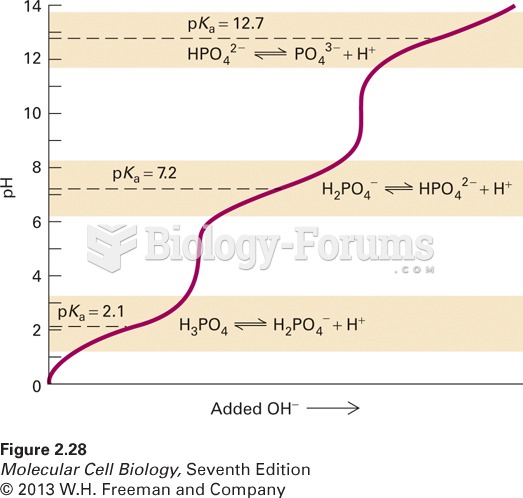 The titration curve of phosphoric acid (H3PO4), a common buffer in biological sy
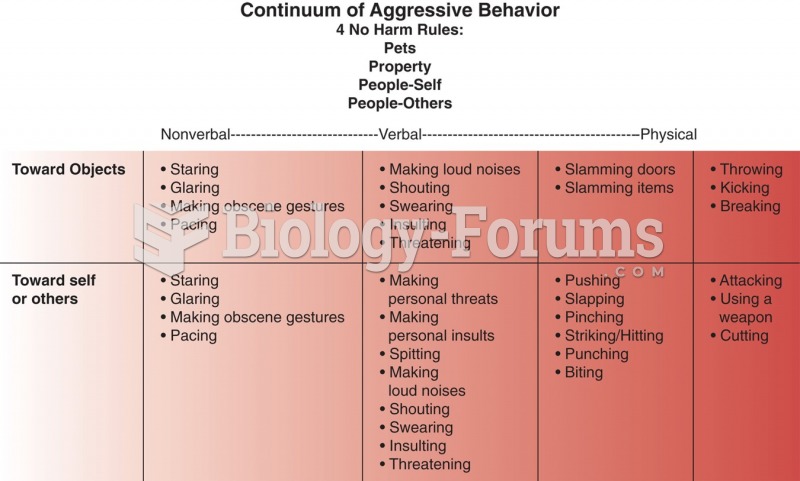 Continuum of aggression. Based on an unpublished figure by Joanne DeSanto Iennaco.
 The fuel level must be above 15% and below 85% before the EVAP monitor will run on most vehicles.
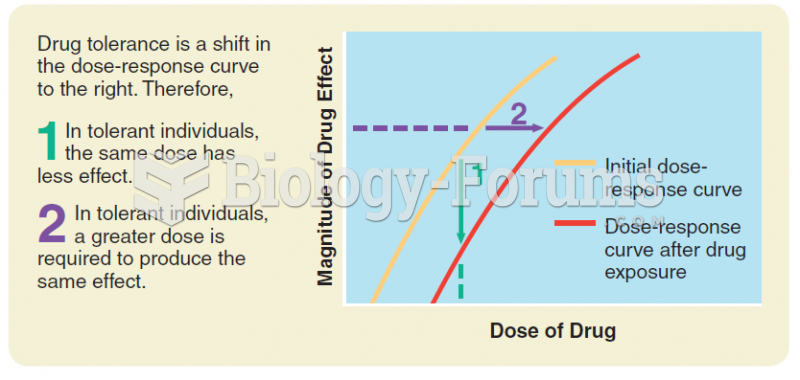 Drug tolerance: A shift in the dose-response curve to the right as a result of exposure to the drug.
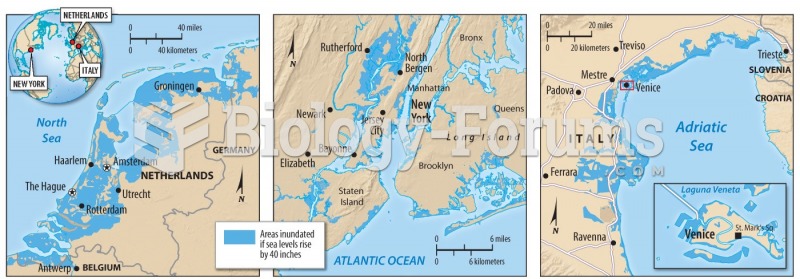 Rising sea level: Some areas will be affected by a rise of just 40 cm