This topic contains a solution. Click here to go to the answer
|
|
|

 Historian James Merrell notes several errors in Benjamin West’s famous 1771 painting, William Penn’s
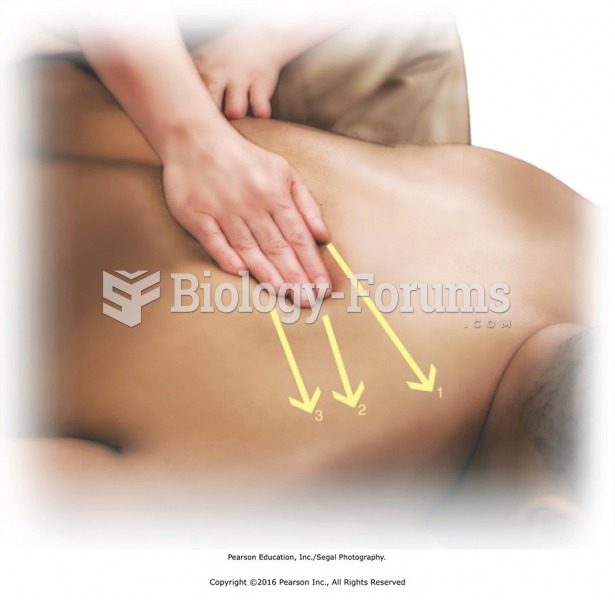 Walk around the head of the table to the left side and reach across to perform threecount stroking ...
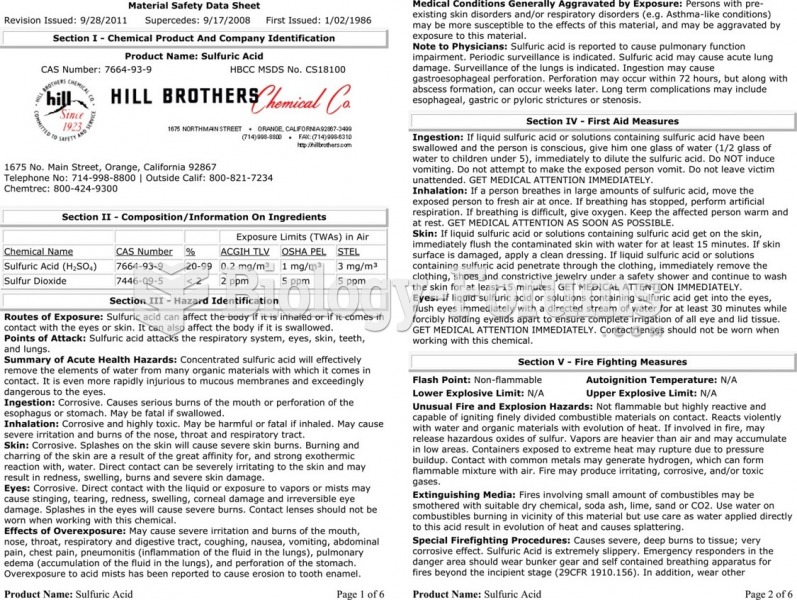 The material safety data sheet (MSDS) for sulfuric acid showing the detailed technical information ...
 Re-creation of Pheidias’s Huge Gold and Ivory Figure of Athena
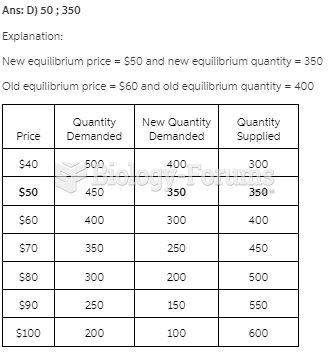 Look at Table 4.2.2. Consumers learn that the rubber ducks wear out batteries quickly. As a ...
 Handcrafted wooden coffee table