|
|
|

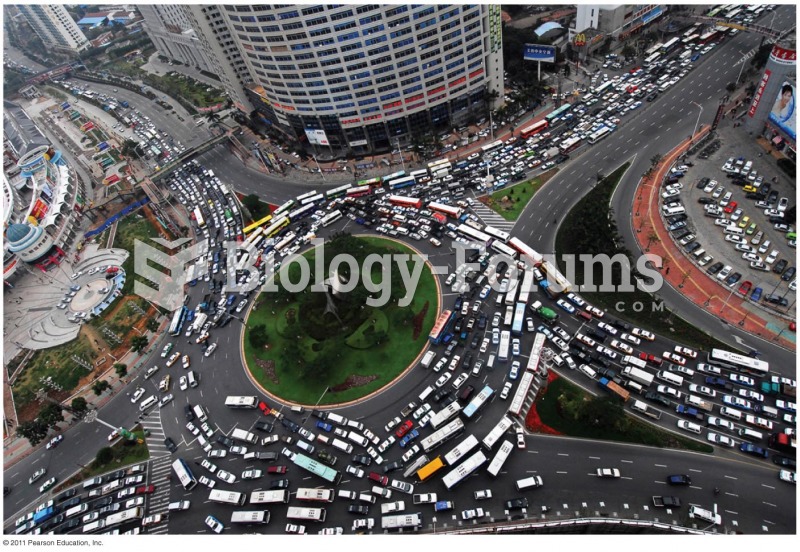 An Oil-dependent World— Supply and Demand Driven
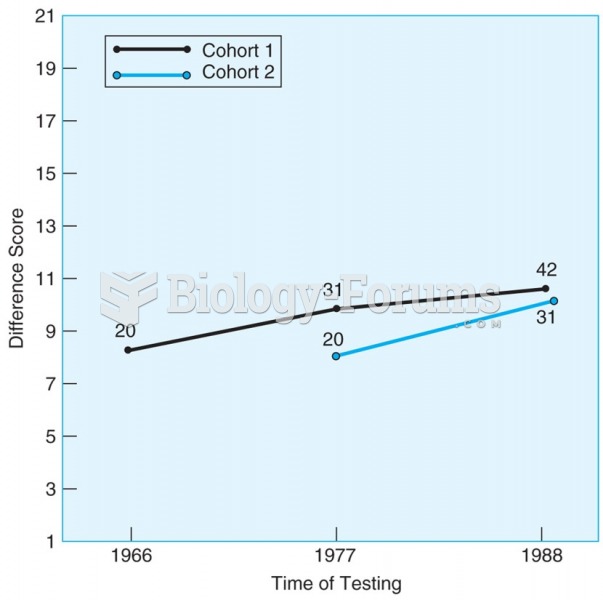 Mean scores for Erikson’s stage V (Identity) for two cohorts. Scores for both cohorts increase ...
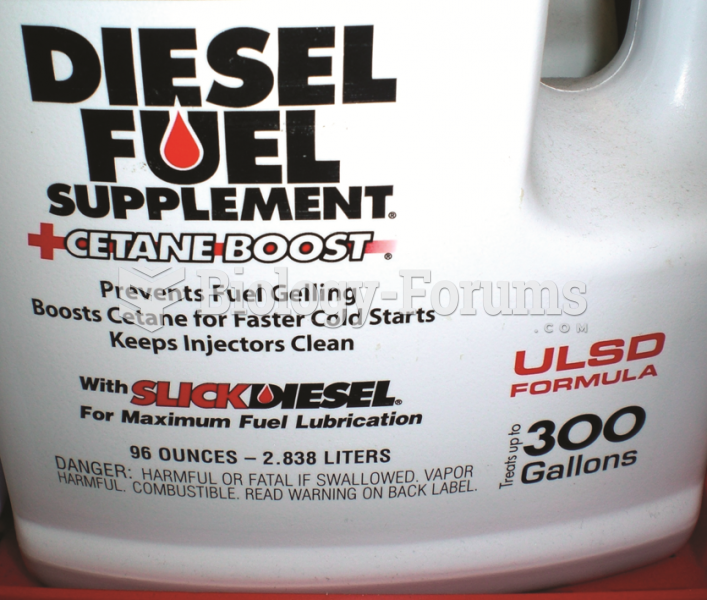 Many diesel fuel additives increase the cetane rating which results in improved fuel economy.
 Move joints in hands. Apply scissoring to metacarpals and figure-8s to fingers.
 Keeping your feelings to yourself may increase your stress level
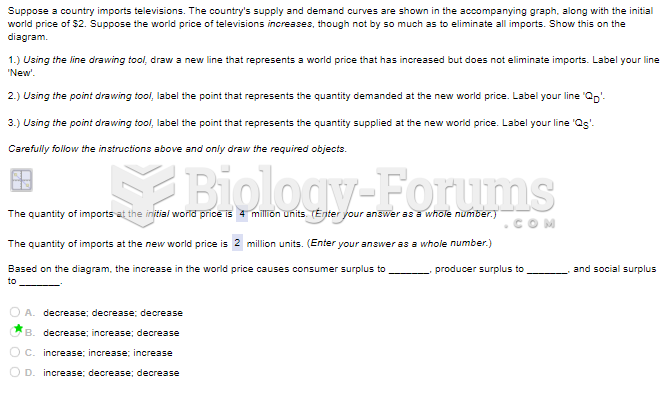 Suppose a country imports televisions. The country's supply and demand curves are shown in ...