|
|
|

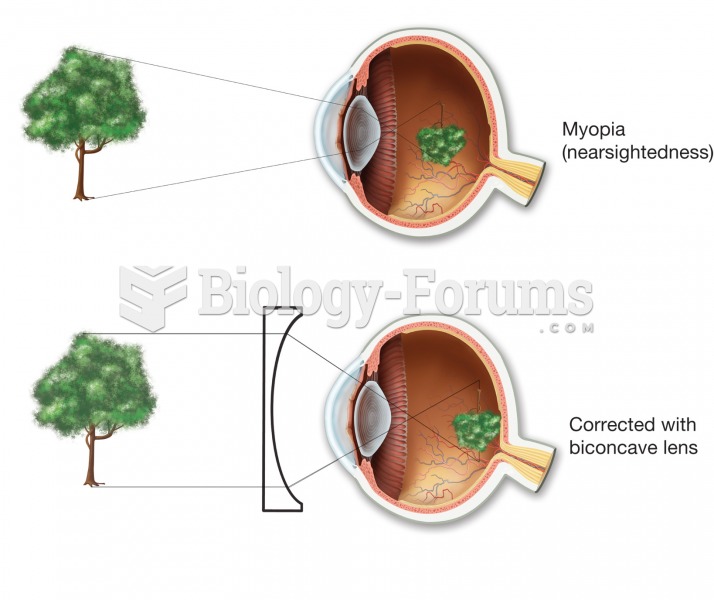 Myopia (nearsightedness). In the uncorrected top figure, the image comes into focus in front of the
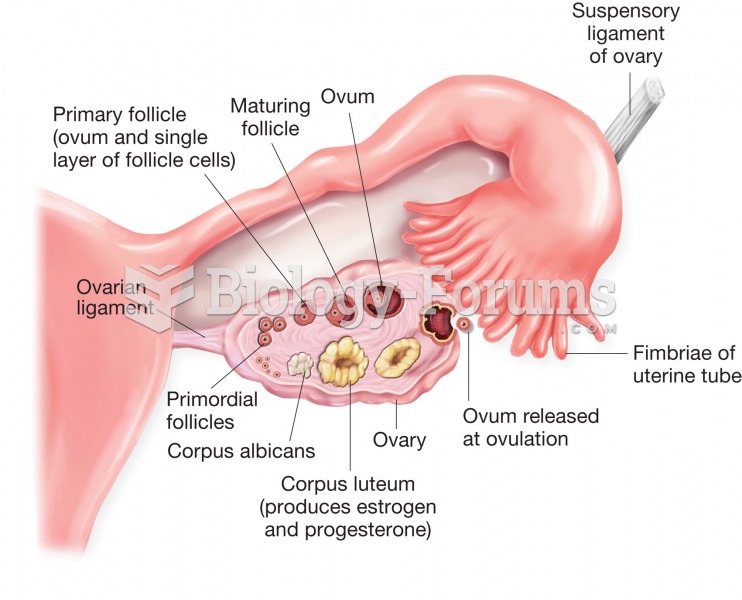 Structure of the ovary and uterine (fallopian) tube. Figure illustrates stages of ovum development a
 This chart illustrates the four quadrants in which we can place the relationships between the state
 In this cartoon, Boss Tweed welcomes cholera—a skeletal figure of death carrying a handbag from “Asi
 C. Wright Mills (1916-1962) was a controversial figure in sociology because of his analysis of the ...
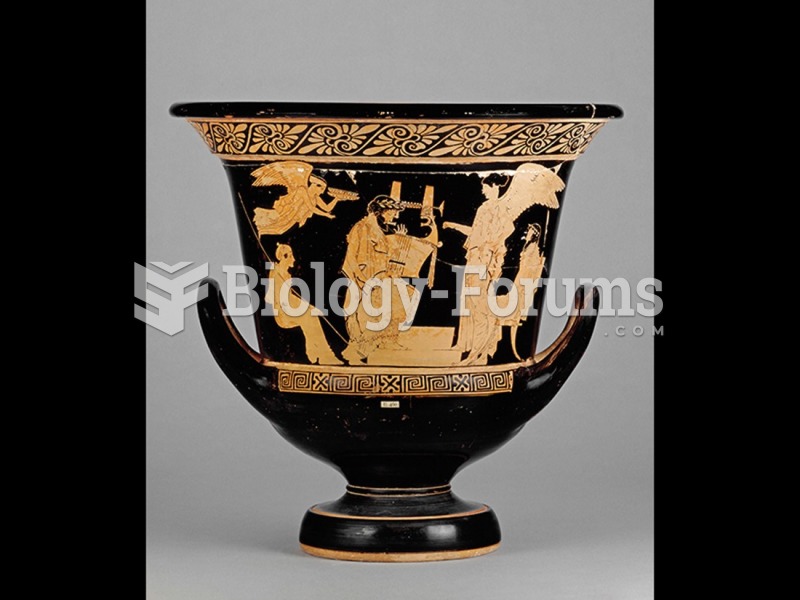 Attributed to the Manner of Peleus Painter, Red-figure calyx-krater.