|
|
|

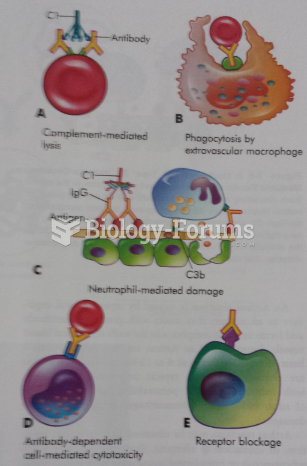 Type II Tissue Specific Reactions
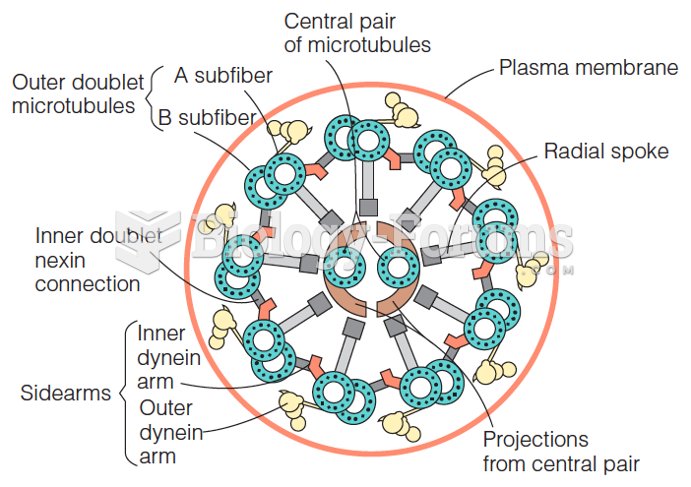 Diagram of the cross section of an axoneme
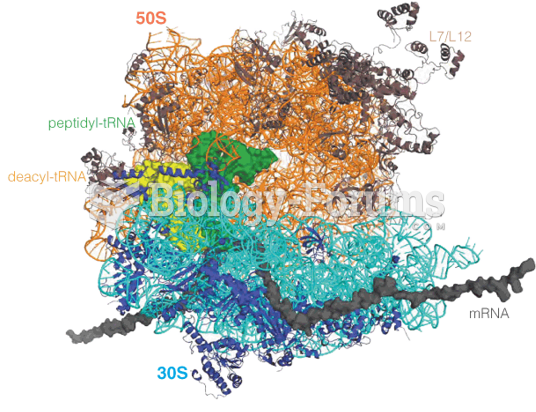 A model of the 70 ribosome, with mRNA and tRNA bound
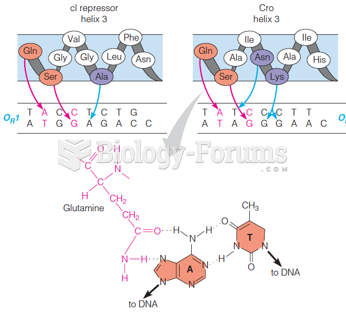 Specific amino acid–nucleotide contacts for cI and Cro repressors
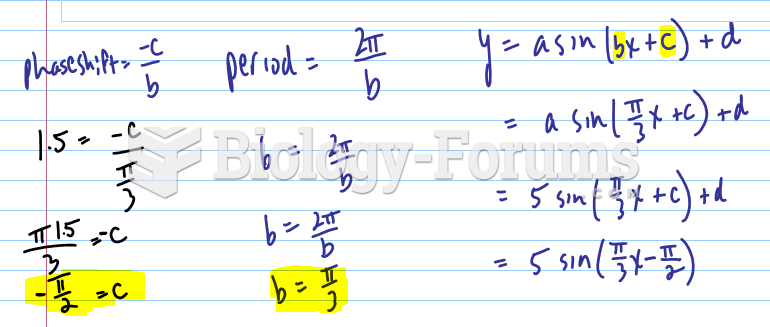 Sketch a graph of the function h(x), by hand on the following interval:
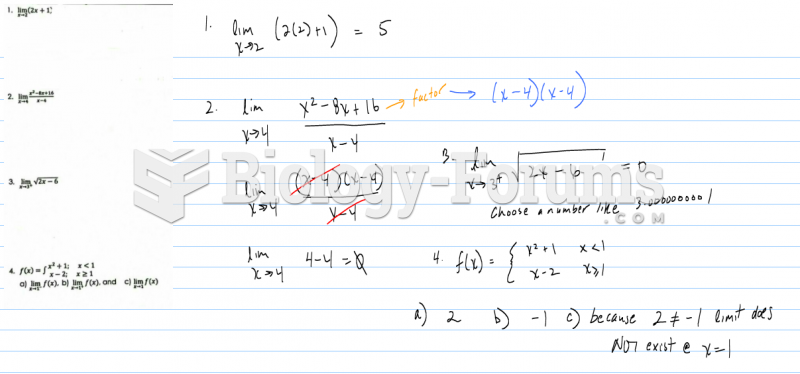 Evaluate then graph the following limits