This topic contains a solution. Click here to go to the answer
|
|
|

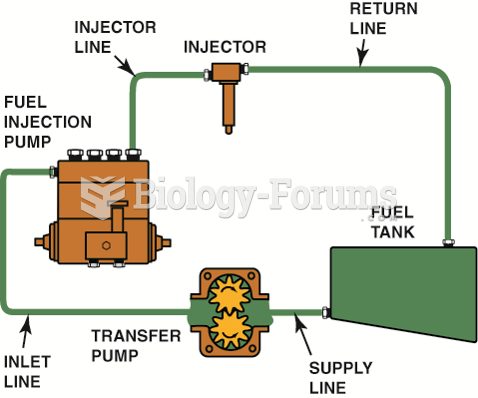 A typical injector-pump-type automotive diesel fuel injection system.
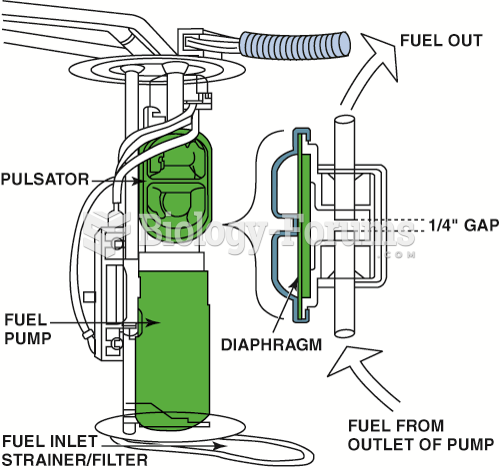 A typical fuel pulsator used mostly with roller vane-type pumps to help even out the pulsation in ...
 Flow cytometry data that shows the differences in CD3+ CD4+ cells that occur with HIV infection. ...
 How to find the quartiles and percentiles for a data set
 How to calculate the mean for grouped data
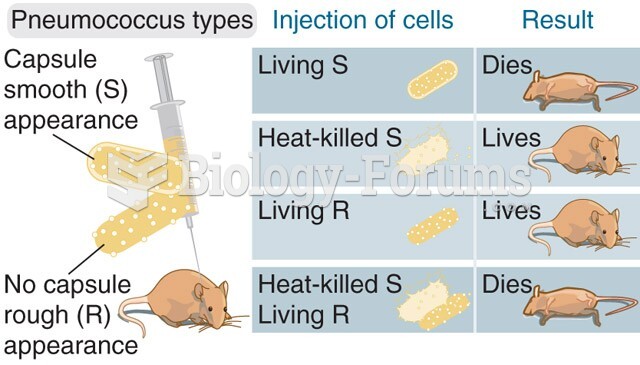 Neither heat-killed S-type nor live R-type bacteria can kill mice, but simultaneous injection of bot