This topic contains a solution. Click here to go to the answer
|
|
|

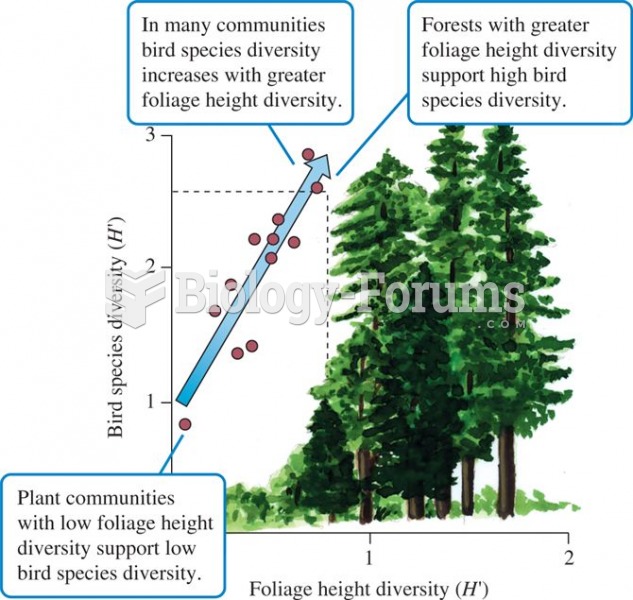 Foliage height diversity and bird species diversity (data from MacArthur and MacArthur 1961).
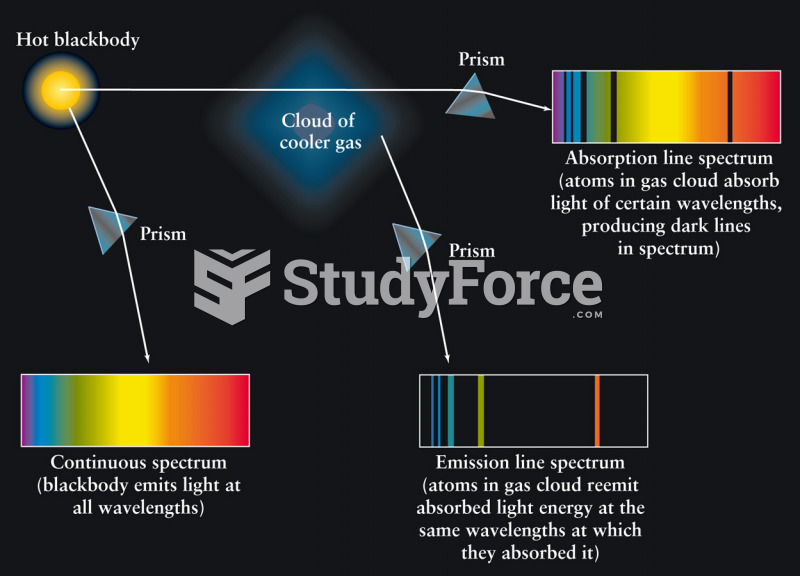 Continuous, Absorption Line, and Emission Line Spectra
 Apply direct thumb pressure into points along the upper trapezius from base of neck to shoulder. ...
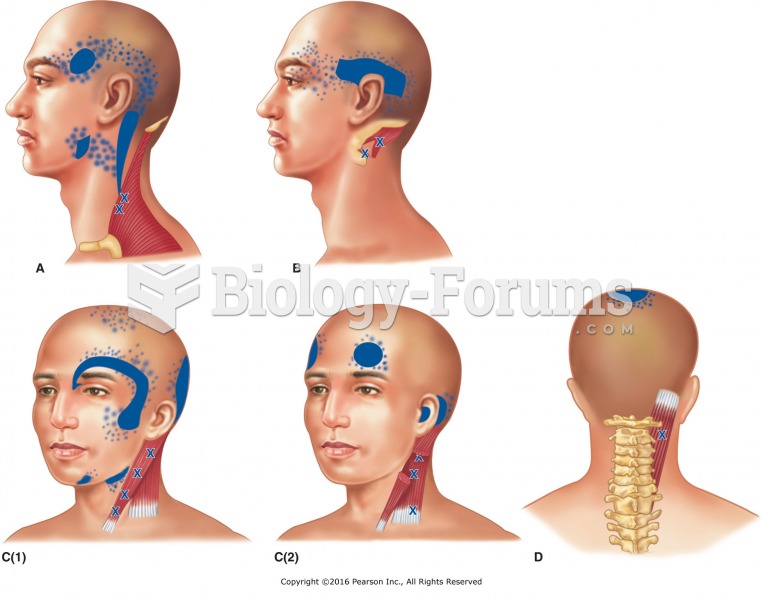 Locations and reference zones of trigger points that cause headaches. A. Upper trapezius. B. ...
 How to calculate the mean for grouped data
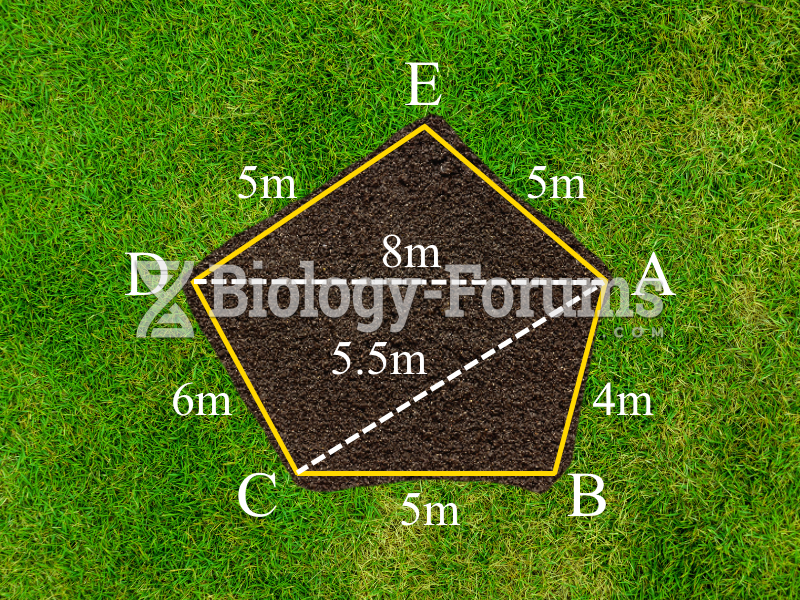 Plot of land (Part c)