This topic contains a solution. Click here to go to the answer
|
|
|

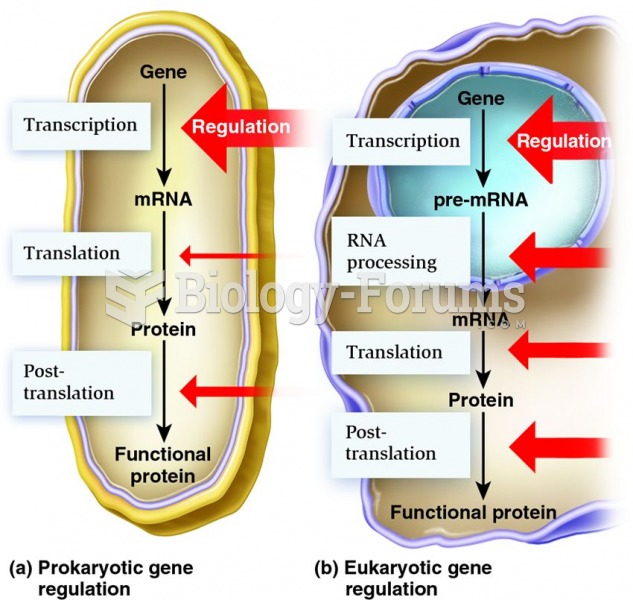 Overview of points of control for gene regulation in (a) prokaryotes and (b) eukaryotes
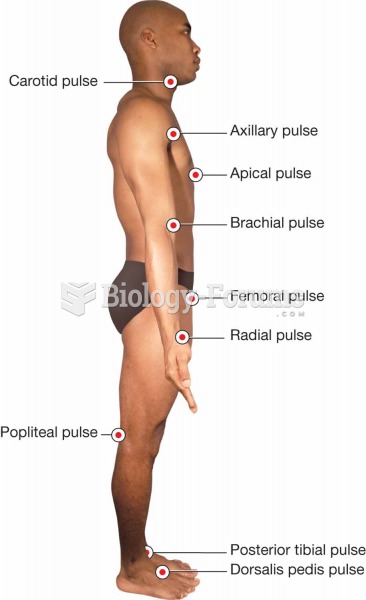 Pulse points.
 This lithograph of the New York draft riots, 1863, shows that although the rioters mainly targeted b
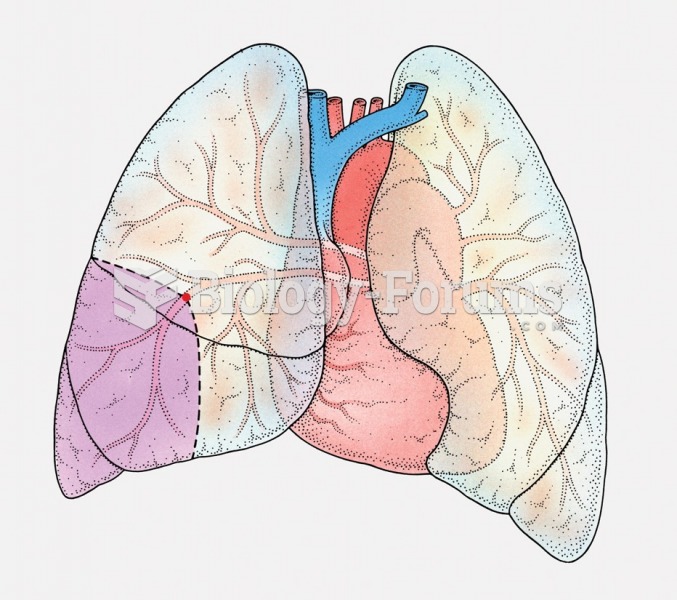 Pulmonary embolism. The purple shaded section shows the area of the lung that is dying from lack of ...
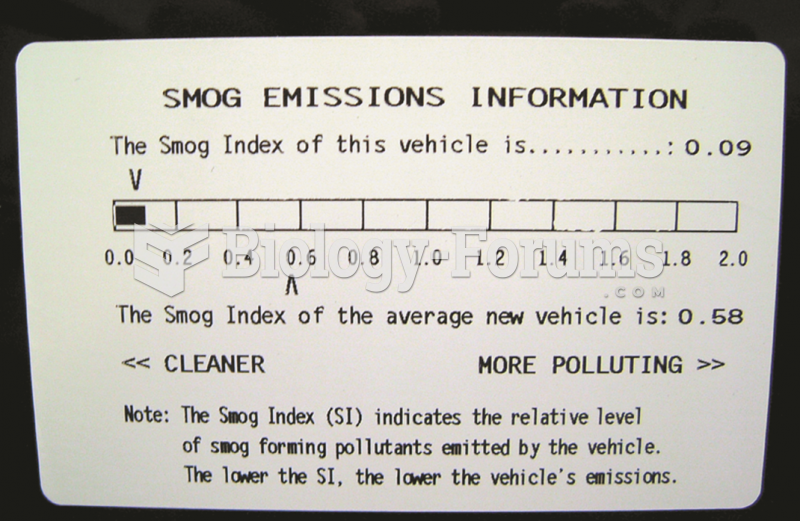 This label on a Toyota Camry hybrid shows the relative smog-producing emissions, but this does not ...
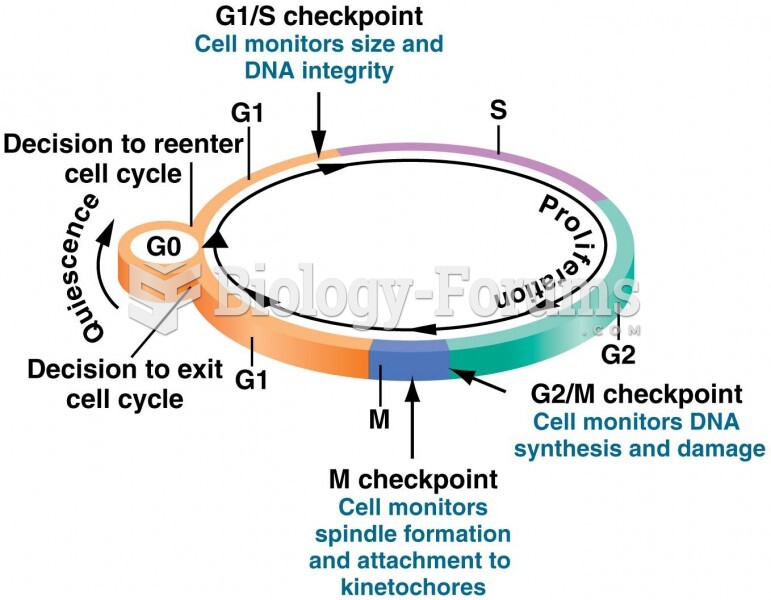 Checkpoints and proliferation decision points monitor the progress of the cell through the cell cycl