This topic contains a solution. Click here to go to the answer
|
|
|

 A close-up of the migrating snails.
 Line analysis of Titian, Assumption and Consecration of the Virgin.
 How to find the quartiles and percentiles for a data set
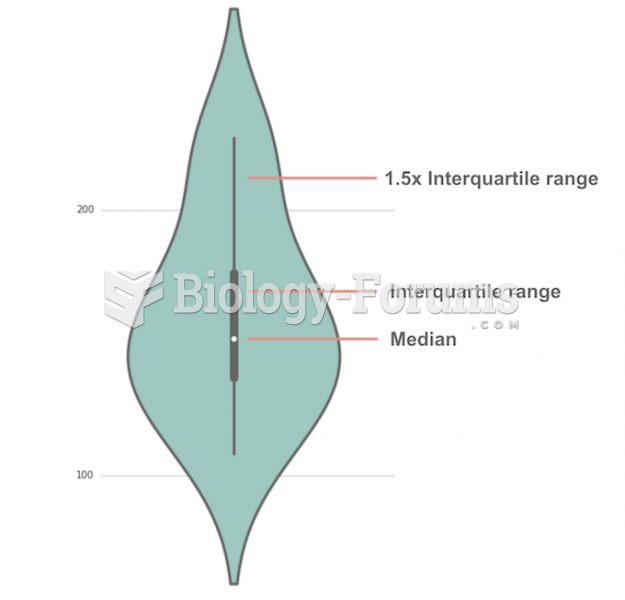 Violin Plot
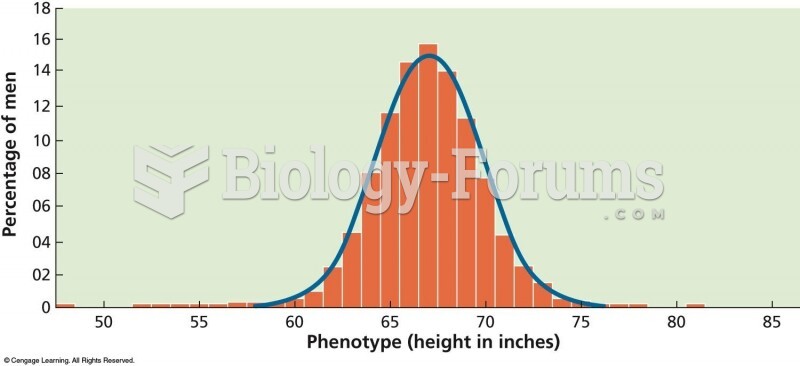 A bell-shaped, or “normal,” curve shows the distribution of phenotypes for traits controlled by ...