|
|
|

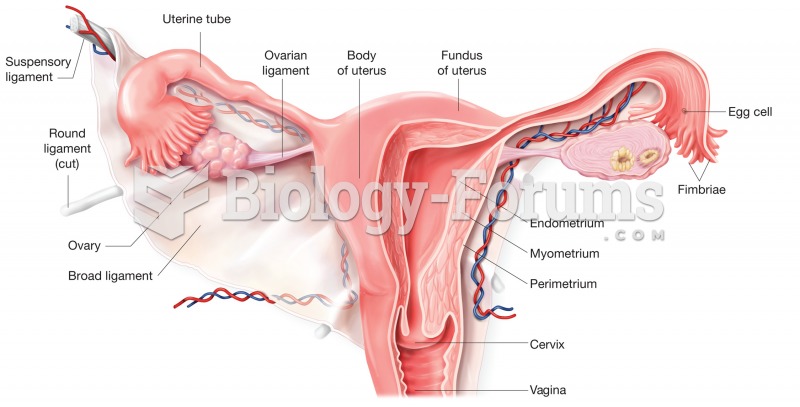 The uterus. Cutaway view shows regions of the uterus and cervix and its relationship to the uterine
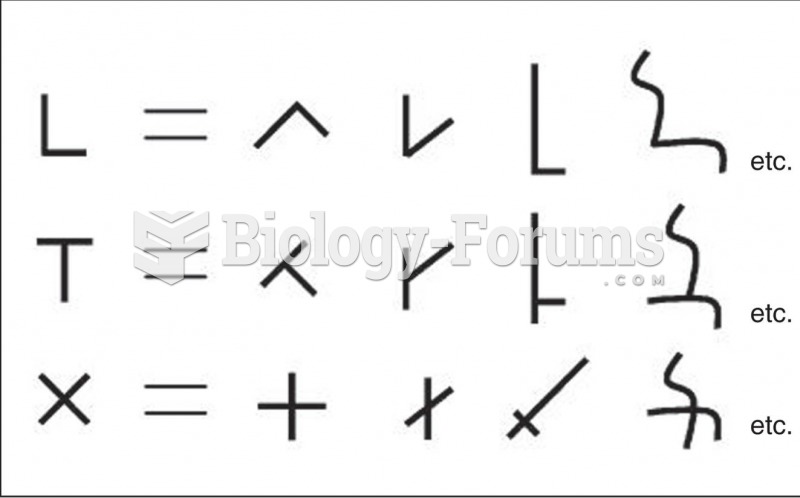 Examples of Ways That Different Types of Intersections of Two Line Segments Can Be Transformed into
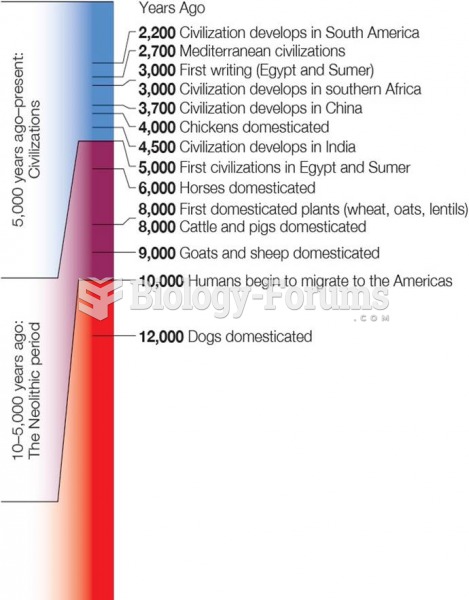 Time Line of Human History From Upper Paleolithic Period to the Present
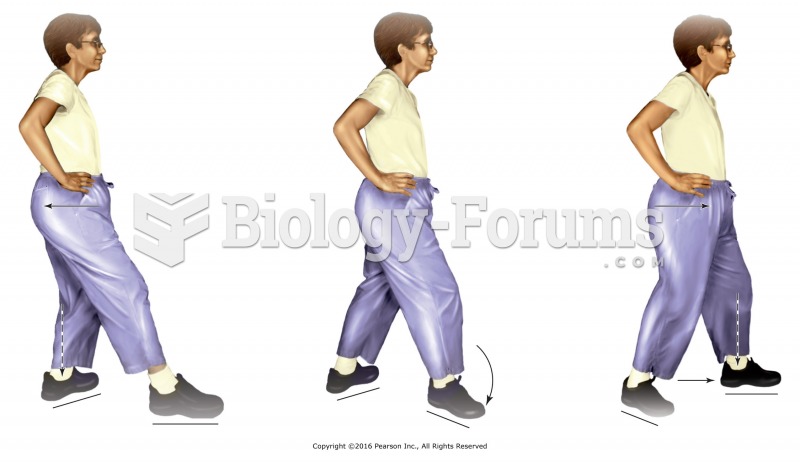 Tai chi walk along straight line. From tai chi stance, shift weight to the back leg and turn the ...
 Time Line for Evolution of the Universe
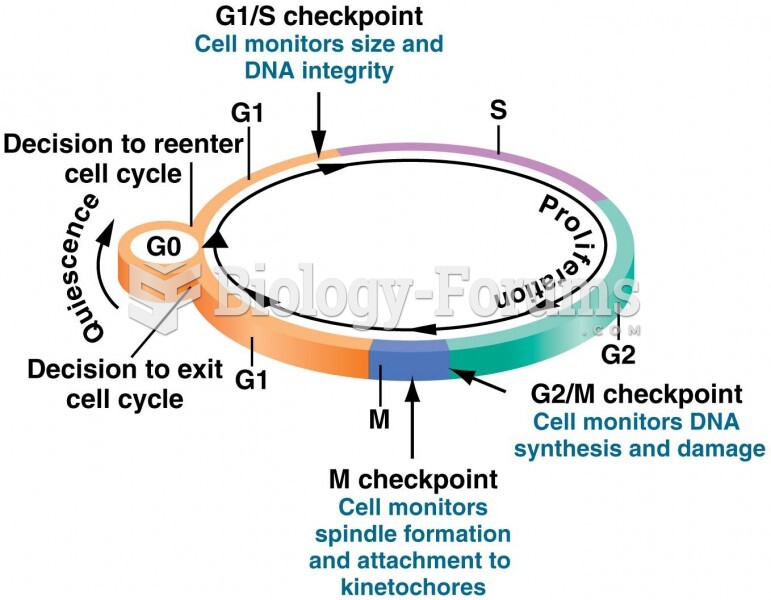 Checkpoints and proliferation decision points monitor the progress of the cell through the cell cycl