|
|
|

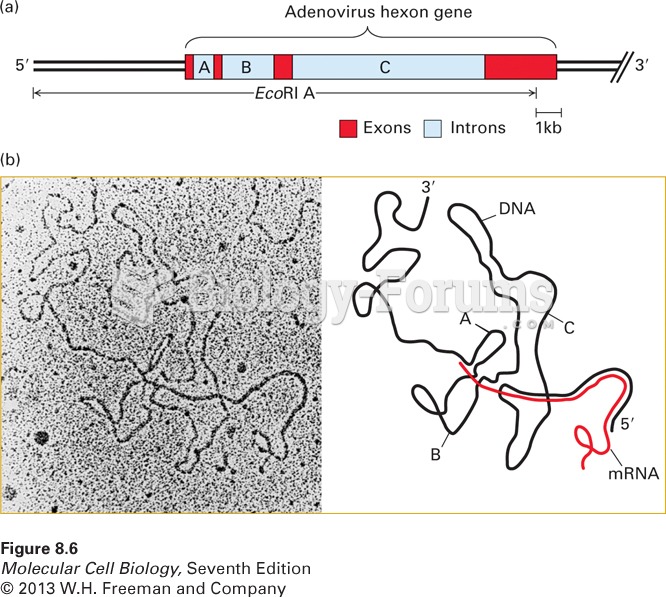 Electron microscopy of mRNA-template DNA hybrids shows that introns are spliced
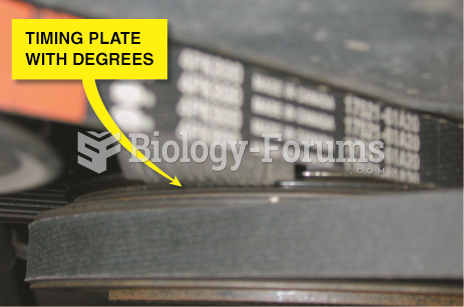 The engine is rotated until the timing marks on the front of the crankshaft line up with zero ...
 Influences on Temperature: South-facing slopes are typically more vegetated than north-facing ...
 Air-Temperature Data
 (A) Thumb slide down nose to (B) St-2. Press points along the cheekbone: (C) LI-20, (D) St-3, (E) ...
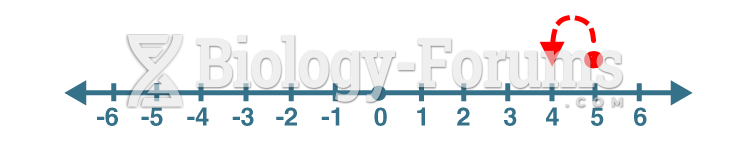 Number line (5 - 1)