|
|
|

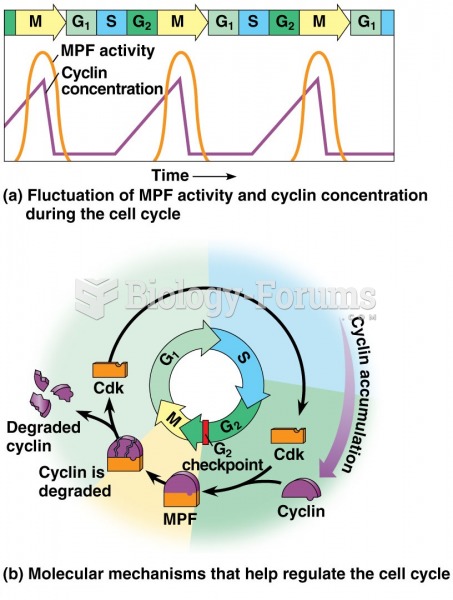 Mitosis + Check Points 4 of 5
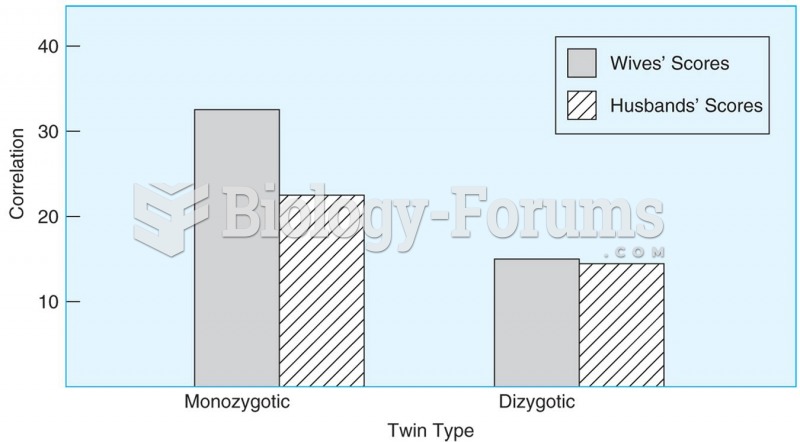 Women who are monozygotic twins and have the same genes are more similar in their marital happiness
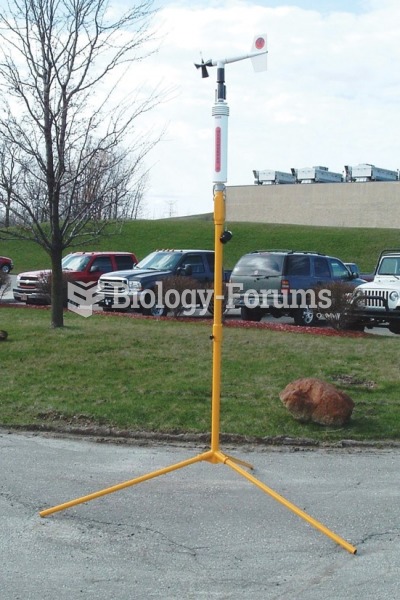 A mobile weather station that can be used to gather current weather data at the scene of hazardous ...
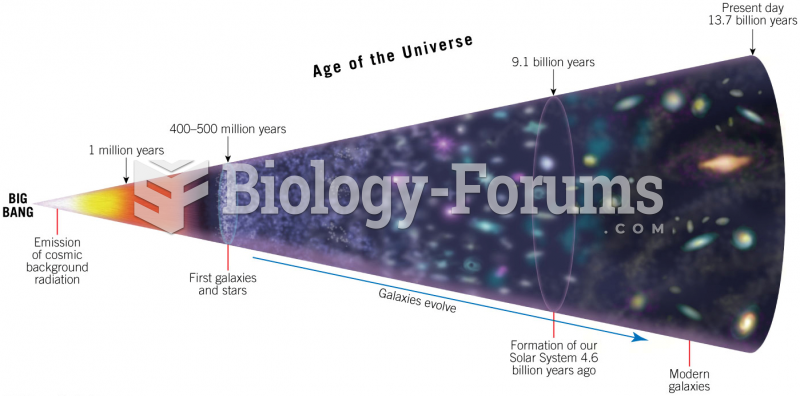 Time Line for Evolution of the Universe
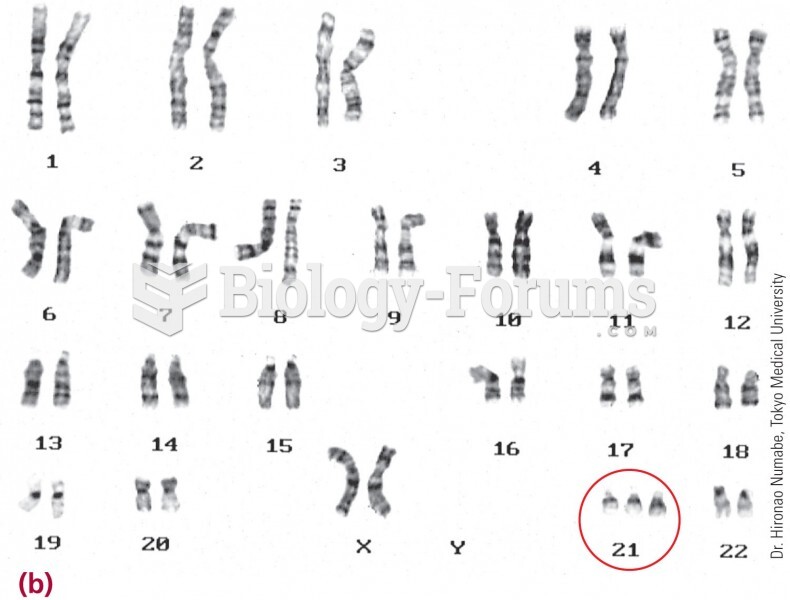 A karyotype shows this child has three copies of chromosome 21.
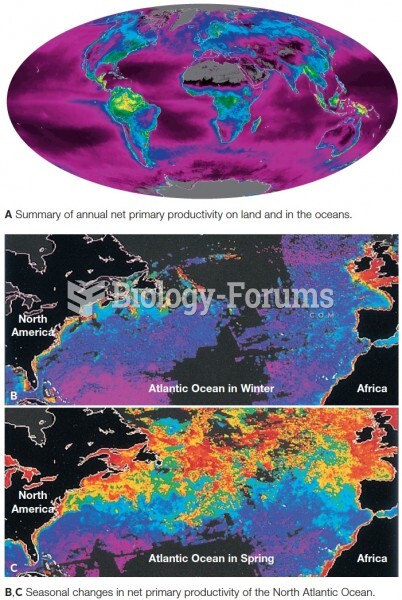 Satellite data showing net primary production. Productivity is coded as red (highest) down through o