|
|
|

 This image shows growing blood vessels in the retina of a mouse
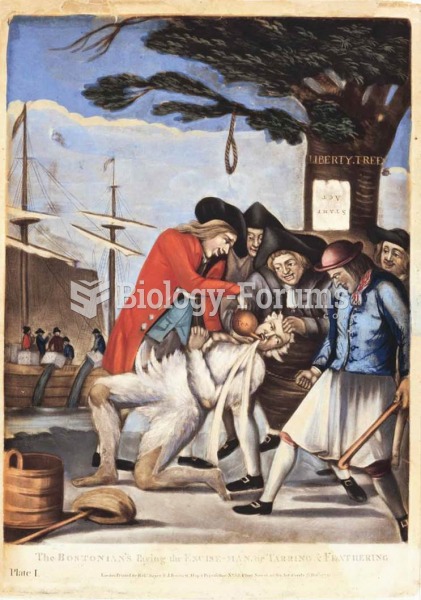 A noose hanging from a “Liberty Tree” reveals this artist’s bias: The “tar-and-feathering” of a Brit
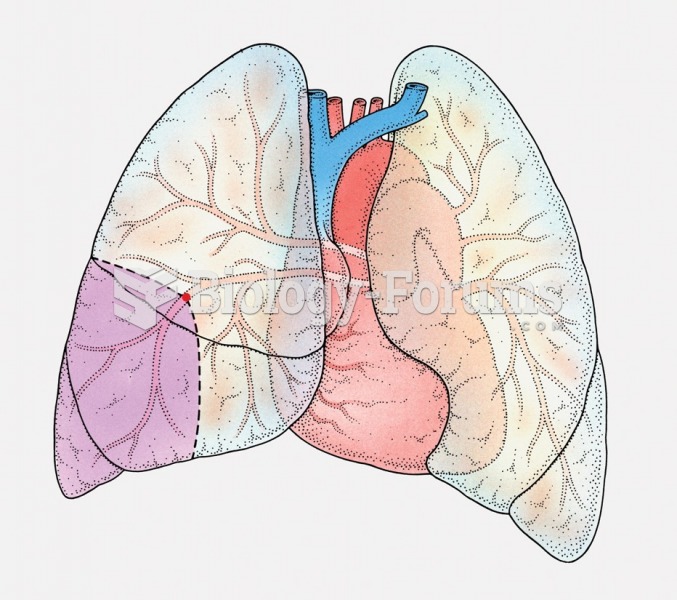 Pulmonary embolism. The purple shaded section shows the area of the lung that is dying from lack of ...
 The posted octane rating in most high-altitude areas shows regular at 85 instead of the usual 87.
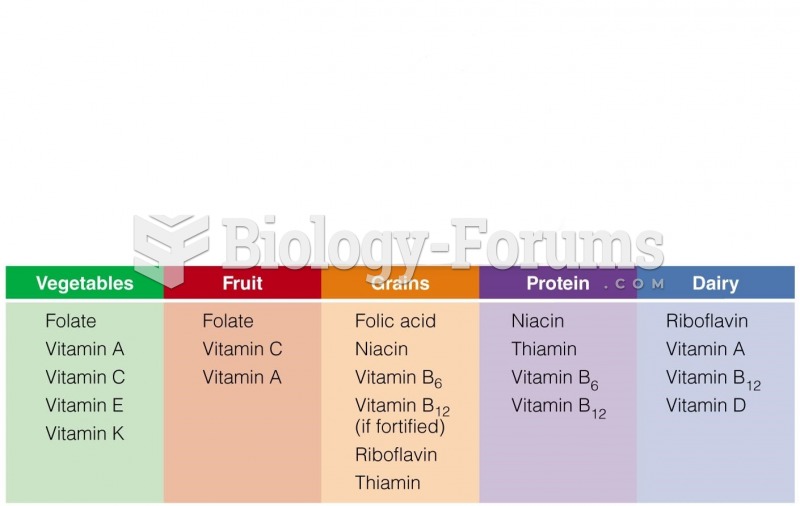 Vitamins Found Widely in the Food Groups
 Linkage Data from 39 Families with Cystic Fibrosis