This topic contains a solution. Click here to go to the answer
|
|
|

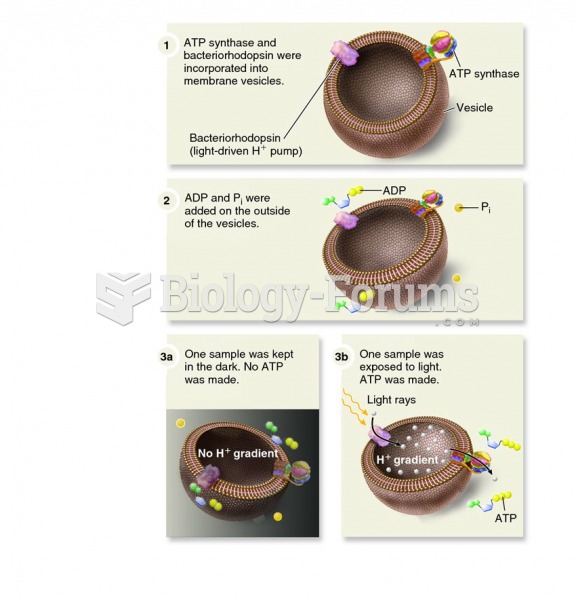 The Racker and Stoeckenius experiment showing that an H+ electrochemical gradient drives ATP synthes
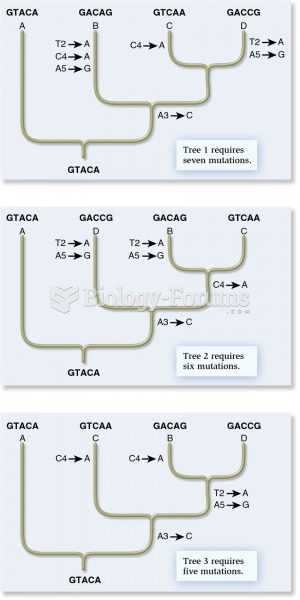 The cladistic approach from molecular genetic data
 Some of the bacteria that can fix atmospheric nitrogen, converting it into a form usable by plants.
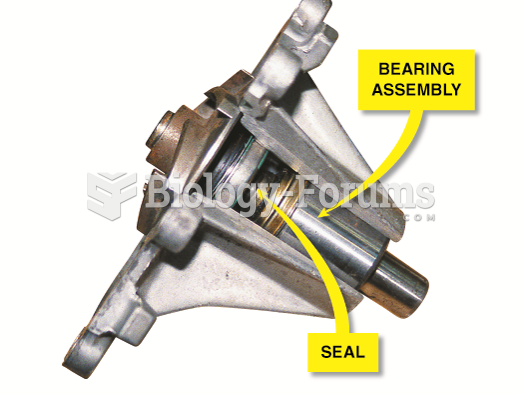 A cutaway of a typical water pump showing the long bearing assembly and the seal. The weep hole is ...
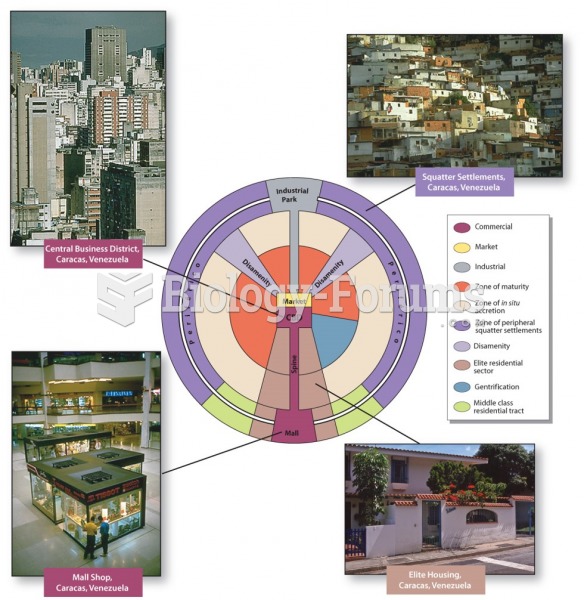 Urban Form
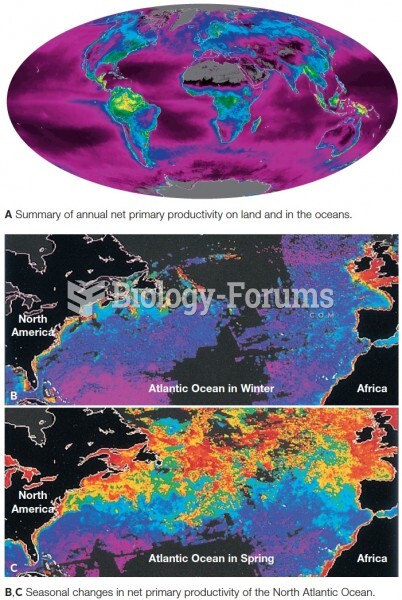 Satellite data showing net primary production. Productivity is coded as red (highest) down through o