This topic contains a solution. Click here to go to the answer
|
|
|

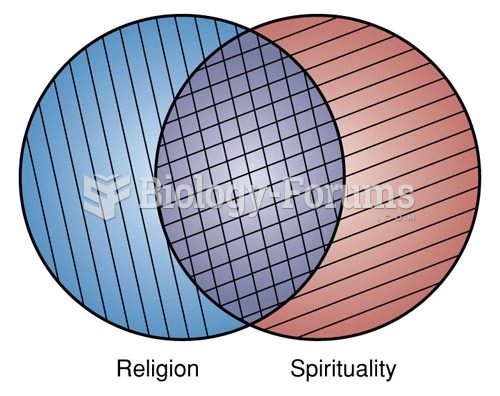 The Relationship Between Religion and Spirituality
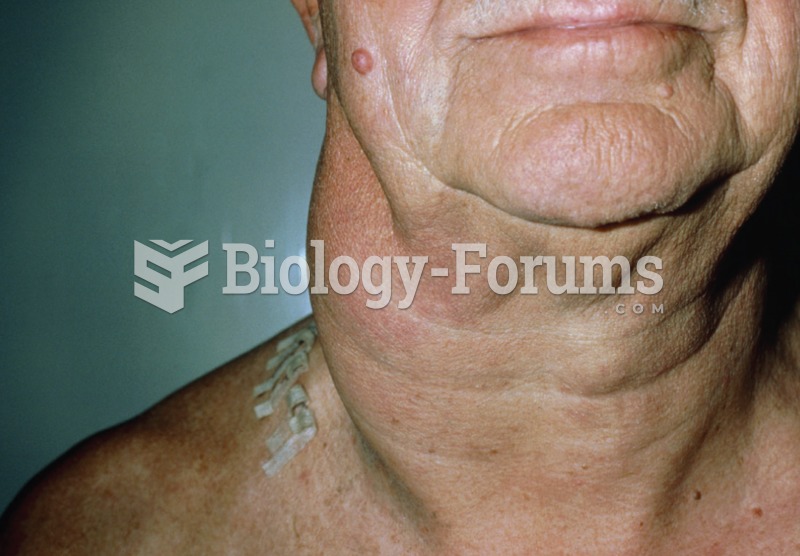 Photo of the neck of a patient with non-Hodgkin’s lymphoma showing the swelling associated with enla
 Attachment is a close emotional relationship.
 Streptococci: Individual bacteria that have a rounded shape and have clumped together to form a ...
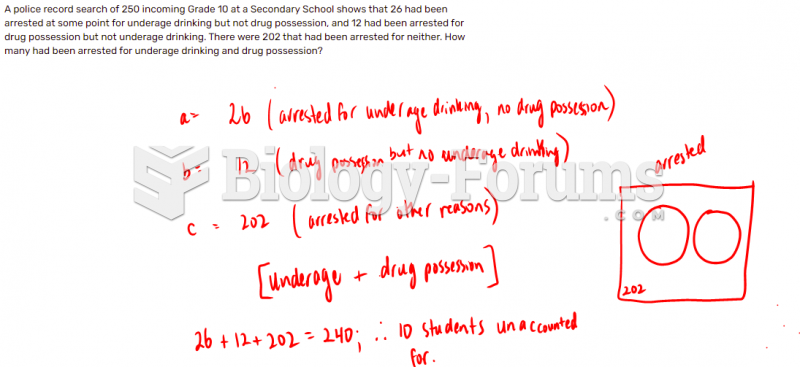 A police record search of 250 incoming Grade 10 at a Secondary School shows that 26 had been ...
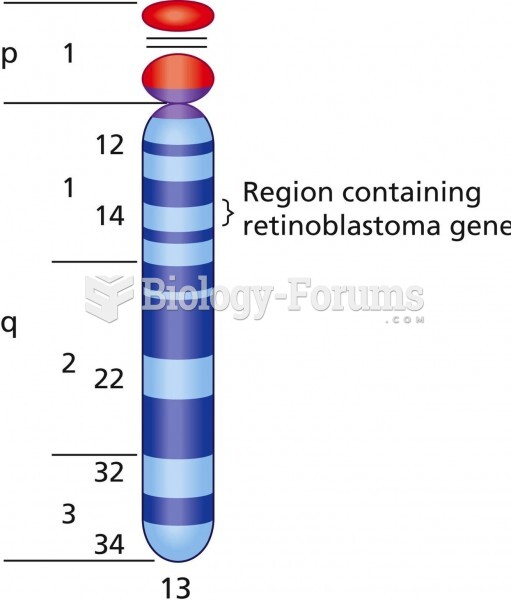 A diagram of chromosome 13, showing the retinoblastoma (RB1) locus