|
|
|

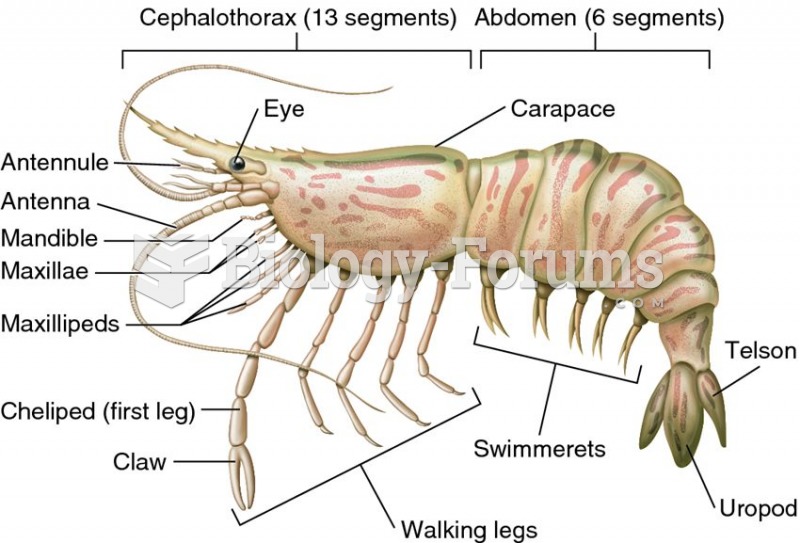 Body plan of a crustacean, as represented by a shrimp
 Family interactions change in response to the developing child, and parenting characteristics, such ...
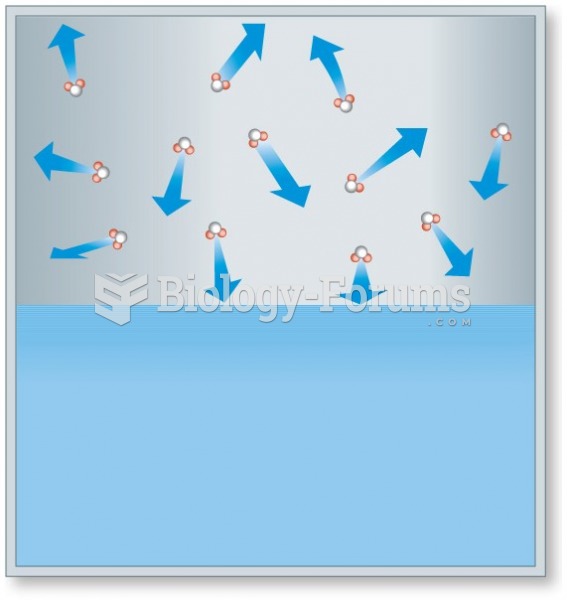 The movement of water vapor molecules exerts vapor pressure on surfaces.
 Molecular Movement
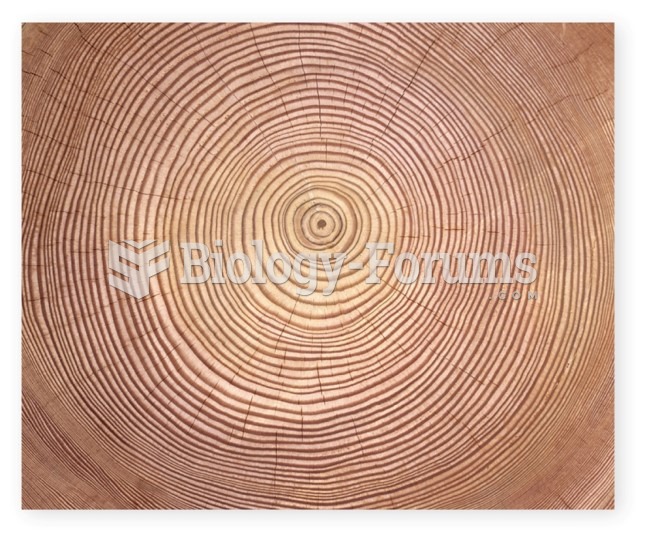 Tree rings as indicators of environmental change
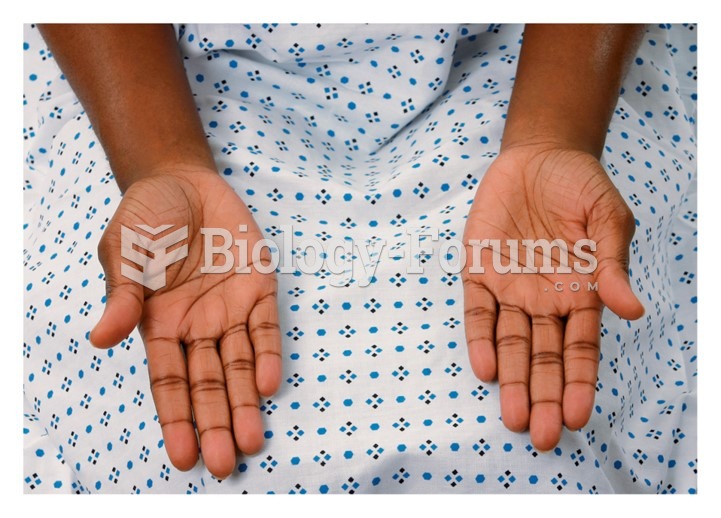 Testing rapid alternating movement, palms up