|
|
|

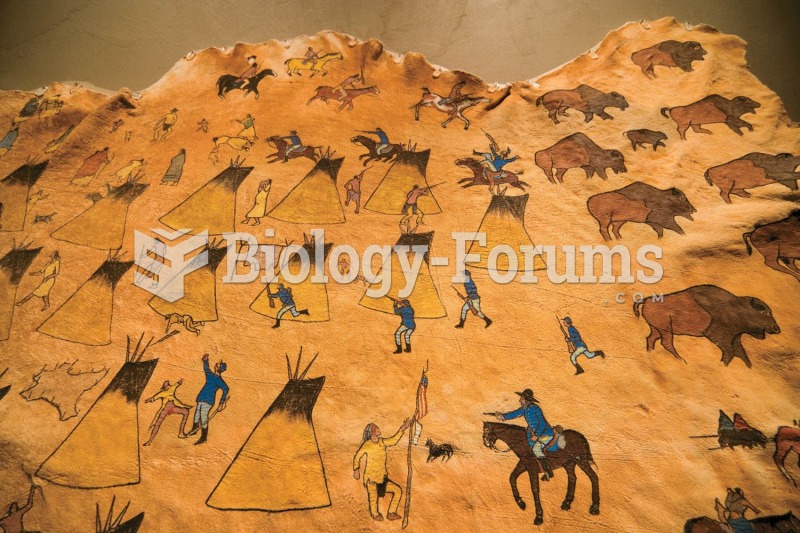 This Native American depiction of the Sand Creek Massacre, painted on a buffalo hide, shows the Indi
 This photo shows a newborn baby minutes after birth.
 The Abecedarian study was designed to help very low-income African American children prepare for ...
 Sketch the graph of each function using transformations. State the domain and range.
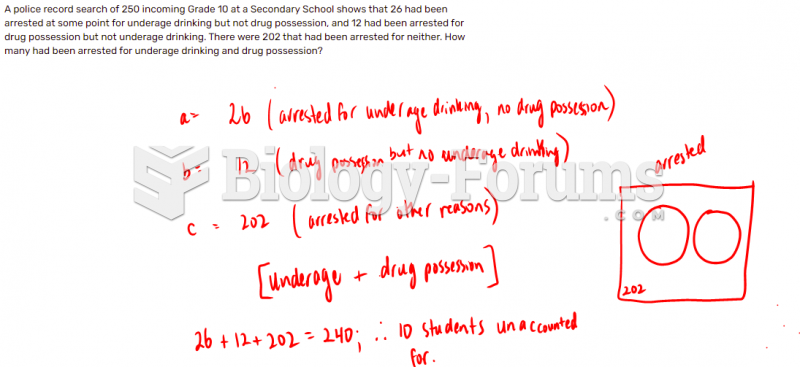 A police record search of 250 incoming Grade 10 at a Secondary School shows that 26 had been ...
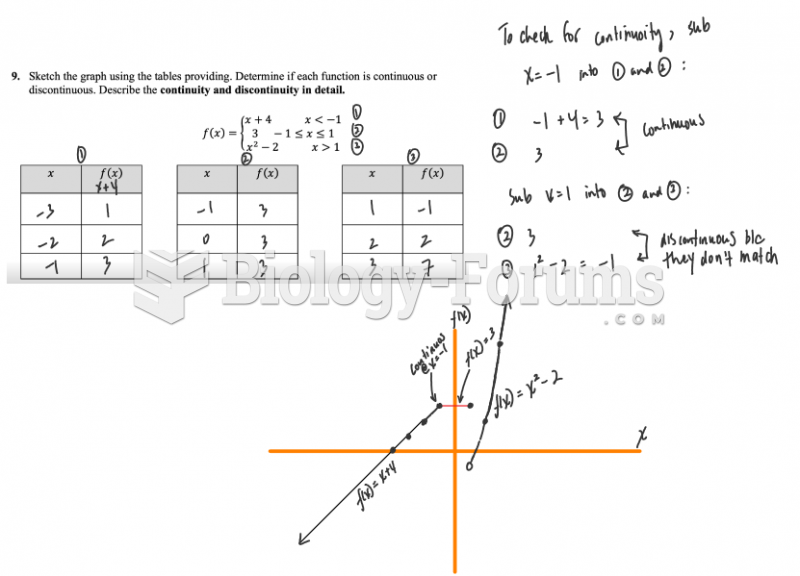 Sketch the graph using the tables providing. Determine if each function is continuous or ...