|
|
|

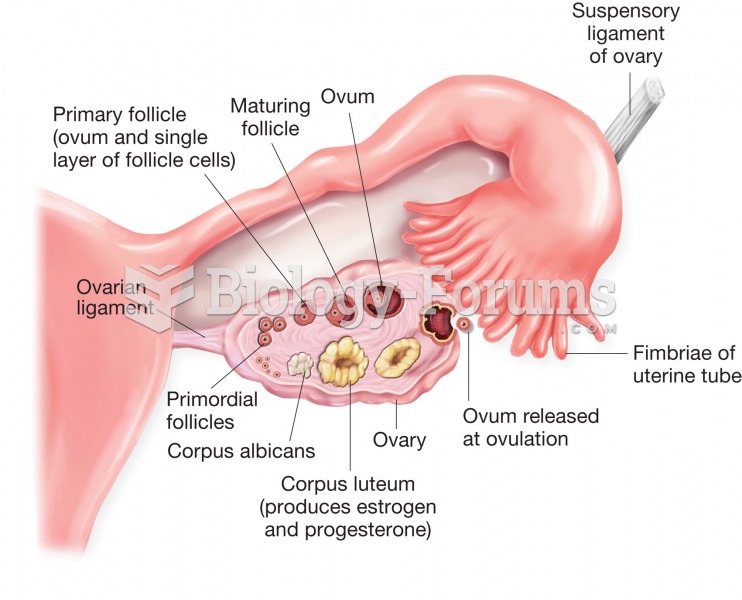 Structure of the ovary and uterine (fallopian) tube. Figure illustrates stages of ovum development a
 Mechanical ventilation. The photograph shows a patient receiving breathing assistance by the use of
 Attention and memory are in demand during circle time.
 Human Figure
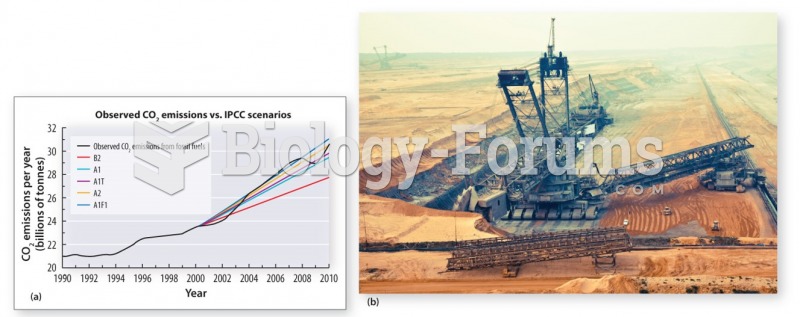 The demand for energy is met by burning coal and other fossil fuels
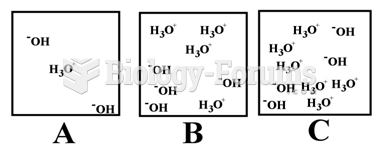 Which of the above illustrations shows an acidic aqueous solution