This topic contains a solution. Click here to go to the answer
|
|
|

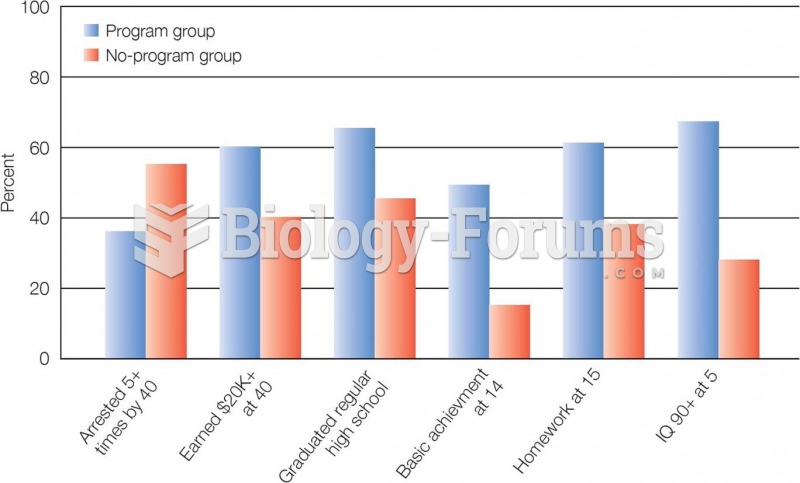 Major Findings of the High Scope Preschool Study High Scope participants showed better academic per
 When the IQ scores of identical twins differ, behavior genetics researchers attribute these to ...
 Performing a Spirometry Test to Measure Forced Vital Capacity
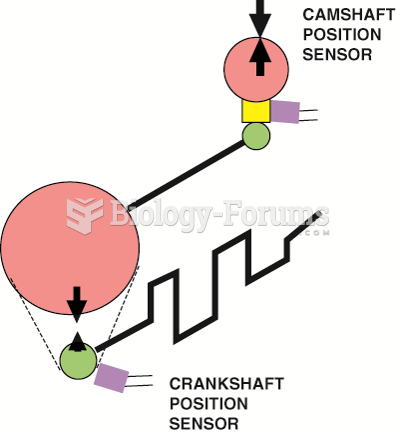 The relationship between the crankshaft position (CKP) sensor and the camshaft position (CMP) sensor ...
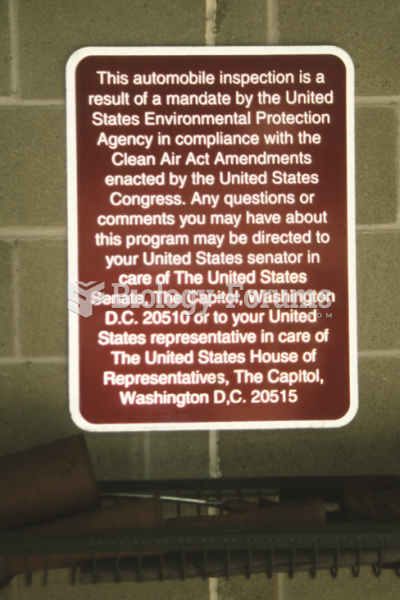 Photo of a sign taken at an emissions test facility.
 Sketch the graph using the tables providing. Determine if each function is continuous or ...