This topic contains a solution. Click here to go to the answer
|
|
|

 This image shows an artists depiction of a 10-kilometer (six-mile) diameter astero
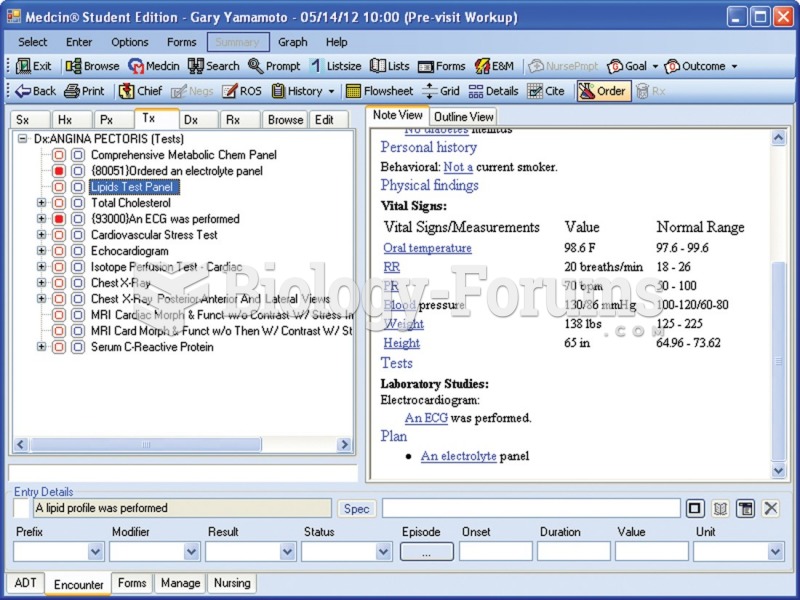 An example of an EHR screen used to order a laboratory test.
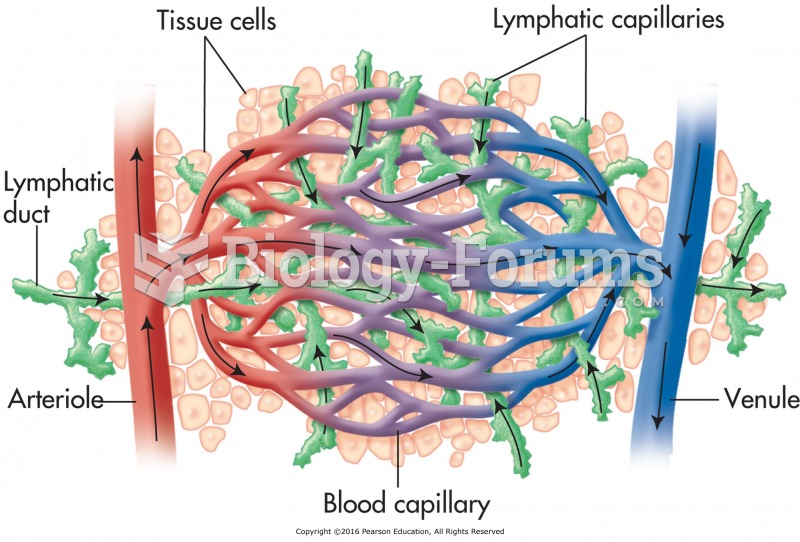 Relationship between blood and lymph capillaries.
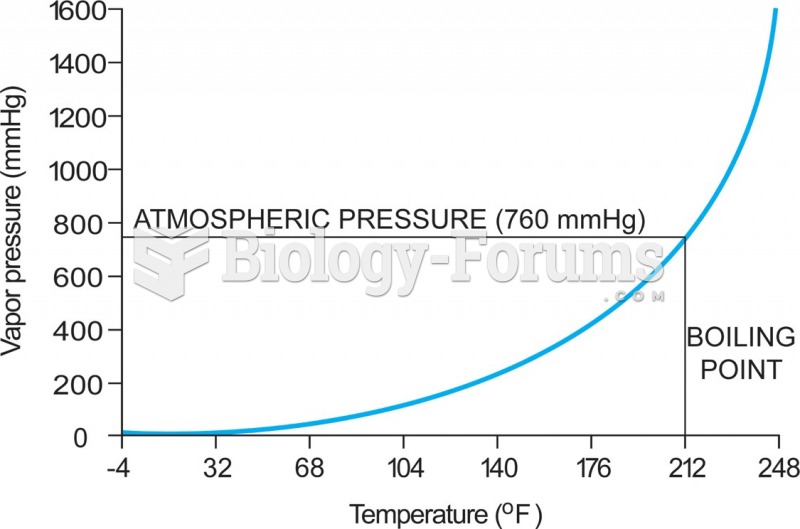 5-4 The relationship between vapor pressure and temperature—in this case for water. As the ...
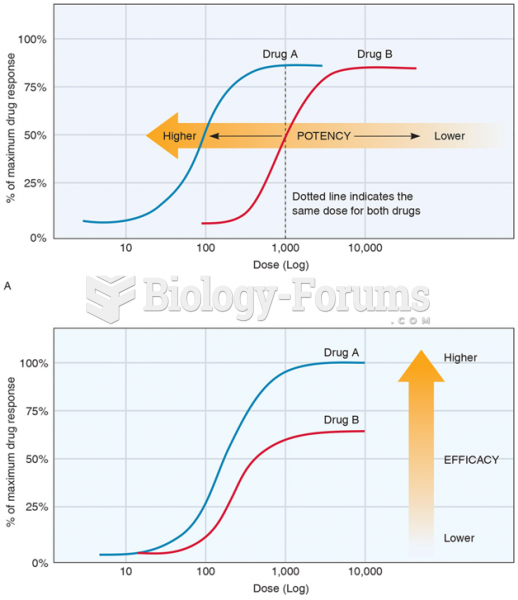 The Dose-Effect Relationship, Showing (A) Drug Potency and (B) Drug Efficacy (Or Effectiveness)
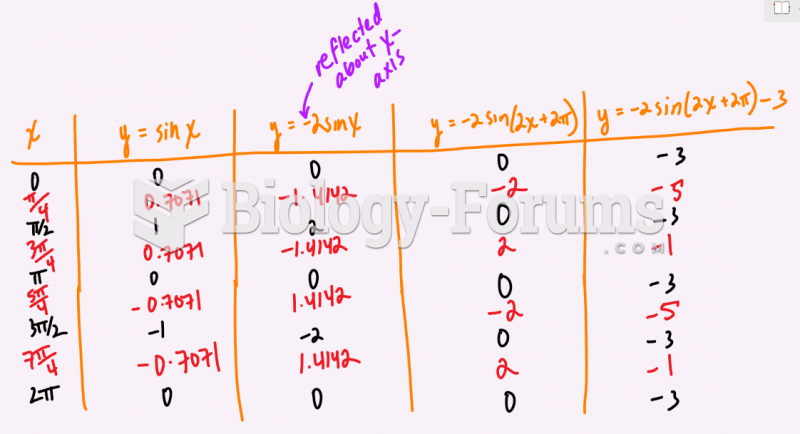 State the transformations on the function f(x)= 4sin(x-pi)-2 and then graph two cycles below.