This topic contains a solution. Click here to go to the answer
|
|
|

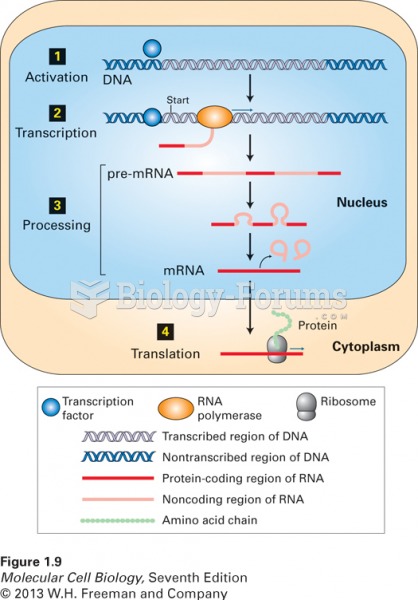 The information coded in DNA
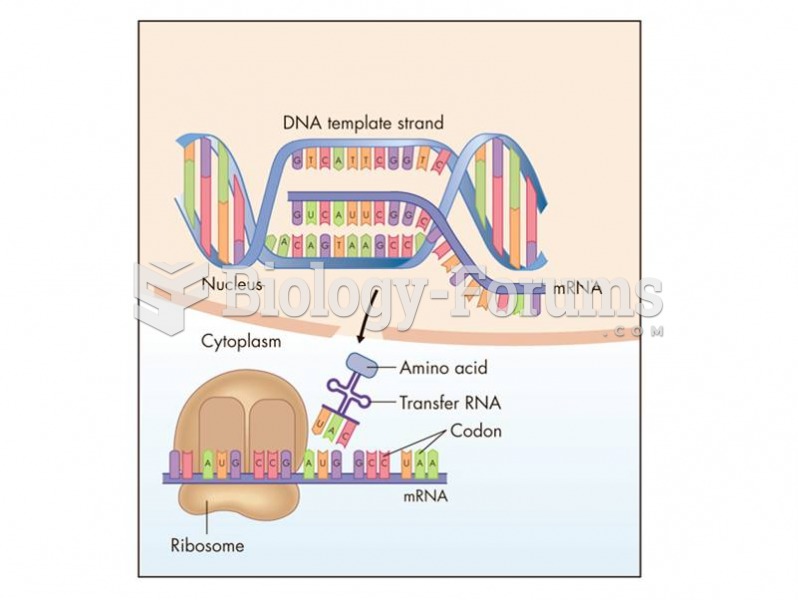 Messenger RNA (mRNA) carries genetic information from the nucleus to the cytoplasm for protein synth
 Pedigree analysis (Widows Peak)
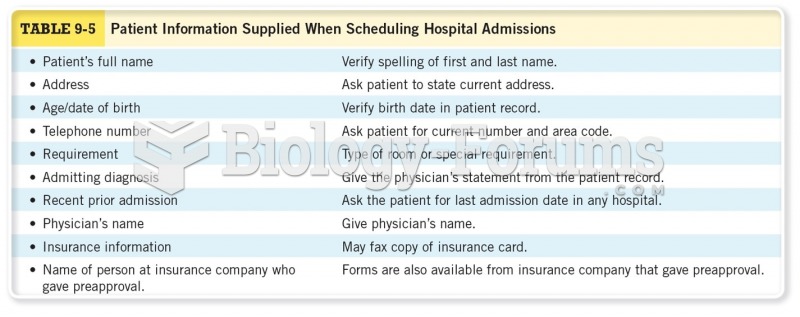 Patient Information Supplied When Scheduling Hospital Admissions
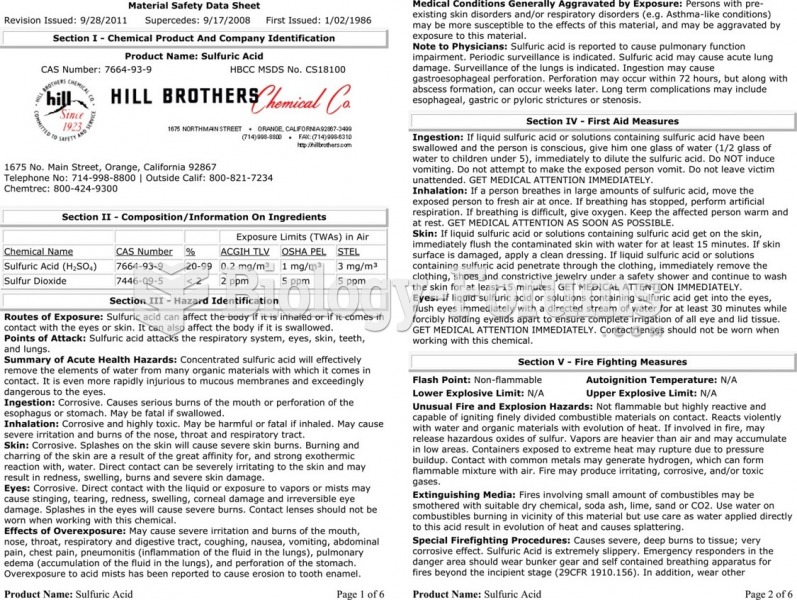 The material safety data sheet (MSDS) for sulfuric acid showing the detailed technical information ...
 Plot of land (Part c)