Figure 13.3 charts the course of voter participation in presidential elections from 1824 to the present. Which decade saw the highest percentile of eligible voters?
a. the 1890s
b. the 1930s
c. the 1980s
d. the 2000s
Question 2
The lifestyle-change theory suggests that one reason for decreased participation in elections is that people are __________.
a. cynical about the campaign and election process
b. now too busy to make time for voting
c. no longer confident in the government
d. less interested in politics as a whole

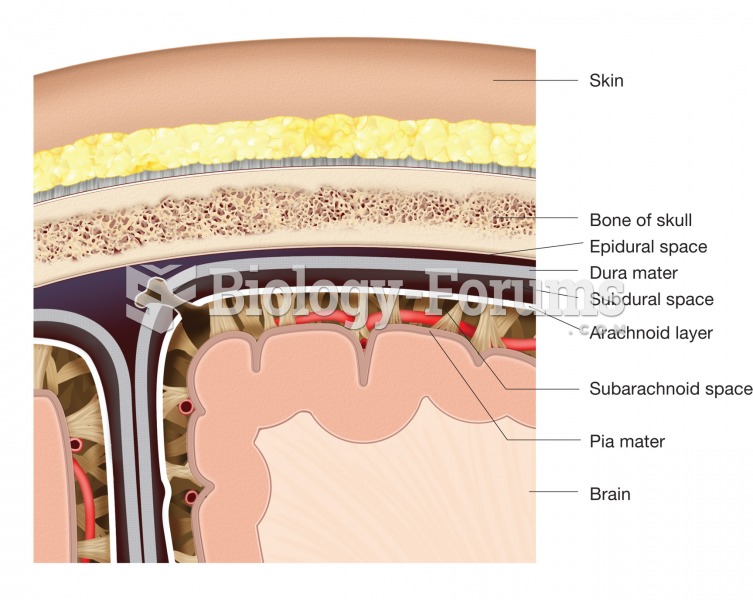 The meninges. This figure illustrates the location and structure of each layer of the meninges and t
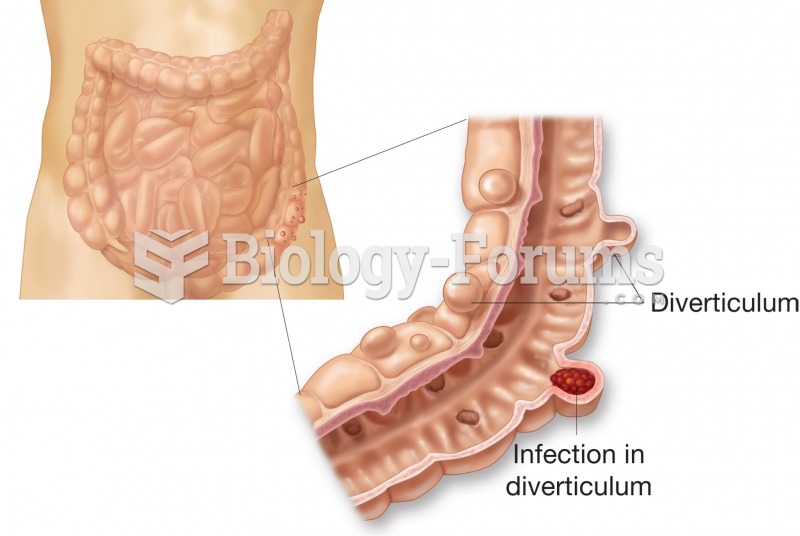 Diverticulosis. Figure illustrates external and internal appearance of diverticula.
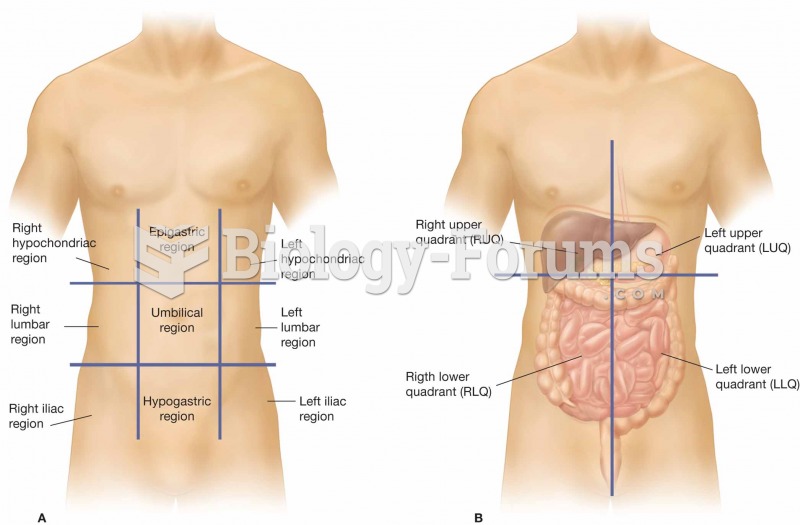 (A) The nine regions of the abdominopelvic cavity. (B) The four regions of the abdomen, which are re
 The 2012 U.S. presidential campaign rang with “get tough” cries to end Iran’s nuclear capacity and c
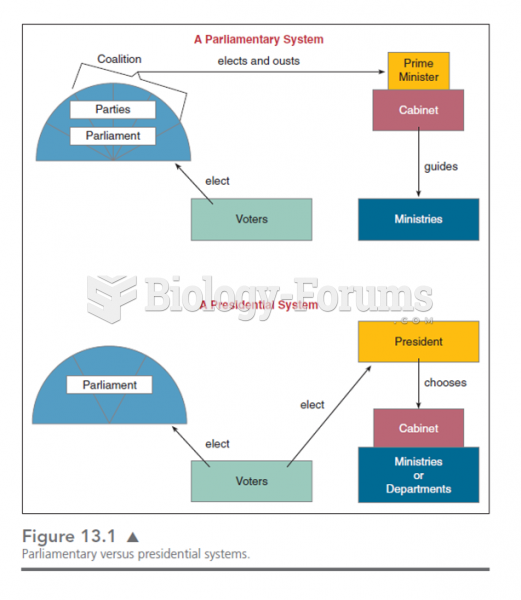 This chart shows the various lines of responsibility and how they differ in presidential and parliam
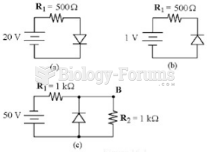 What is the current in Figure 16-1(b) if the diode is made of silicon and the polarity of the ...