Figure 13.3 charts the course of voter participation in presidential elections from 1824 to the present. Which decade saw the highest percentile of eligible voters?
a. the 1890s
b. the 1930s
c. the 1980s
d. the 2000s
Question 2
The lifestyle-change theory suggests that one reason for decreased participation in elections is that people are __________.
a. cynical about the campaign and election process
b. now too busy to make time for voting
c. no longer confident in the government
d. less interested in politics as a whole

 In this cartoon, Boss Tweed welcomes cholera—a skeletal figure of death carrying a handbag from “Asi
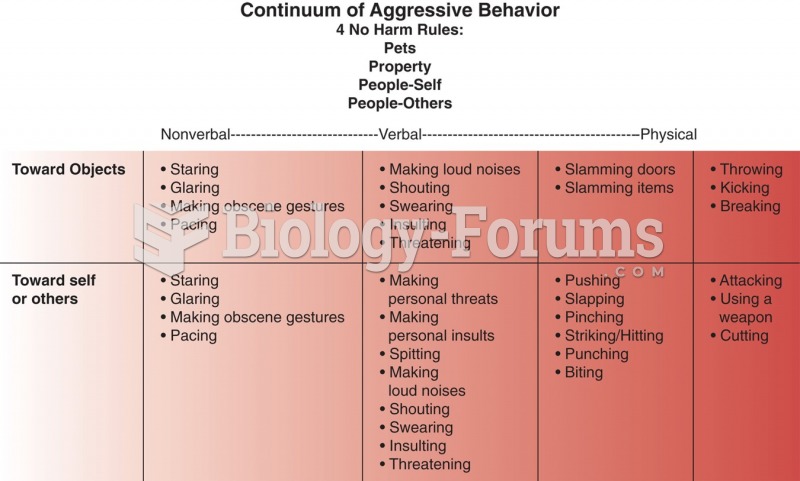 Continuum of aggression. Based on an unpublished figure by Joanne DeSanto Iennaco.
 Figure-8s at the knuckles of the hand.
 Joint movement of the fingers. Apply scissoring at the knuckles and figure-8s to the fingers to ...
 The cube of insulating material shown in the figure has one corner at the origin. Each side of ...
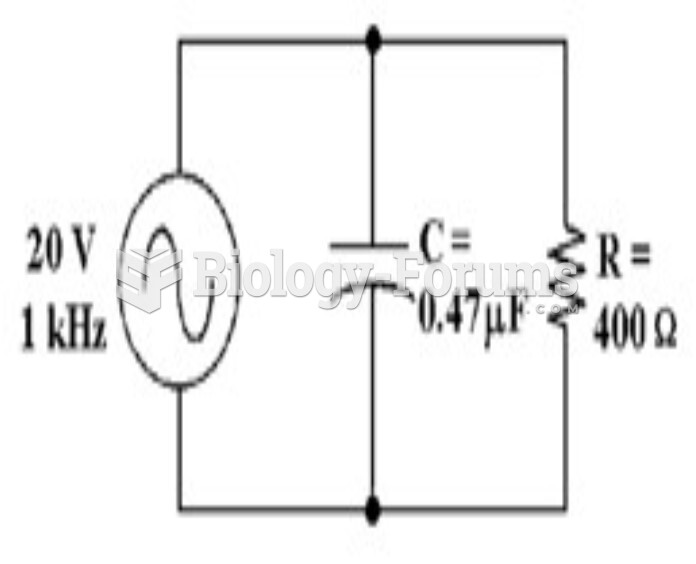 How much voltage does the resistor drop in Figure 10-2?