Figure 13.3 charts the course of voter participation in presidential elections from 1824 to the present. Which decade saw the highest percentile of eligible voters?
a. the 1890s
b. the 1930s
c. the 1980s
d. the 2000s
Question 2
The lifestyle-change theory suggests that one reason for decreased participation in elections is that people are __________.
a. cynical about the campaign and election process
b. now too busy to make time for voting
c. no longer confident in the government
d. less interested in politics as a whole

 Diverticulosis. Figure illustrates external and internal appearance of diverticula.
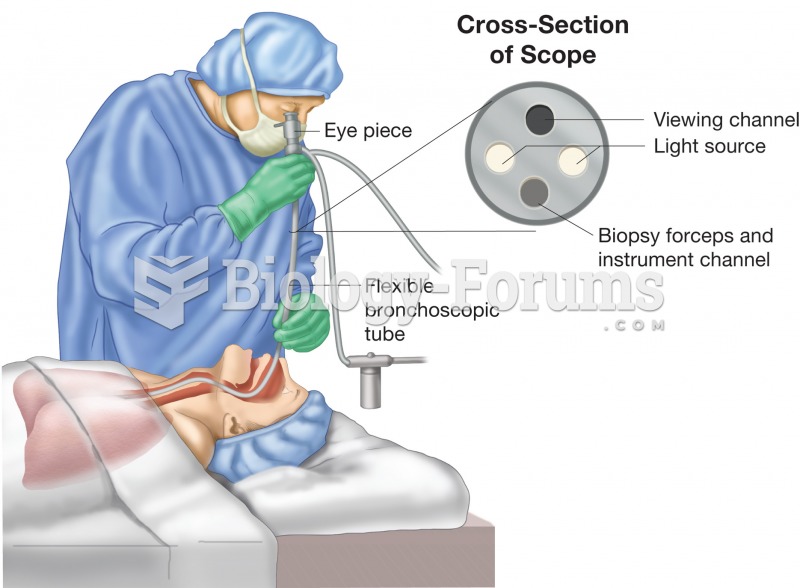 Bronchoscopy. Figure illustrates physician using a bronchoscope to inspect the patient’s bronchial t
 Demonstrate the Application of Triangular, Figure-Eight, and Tubular Bandages
 Mobilize each metatarsal–phalangeal joint with figure-8s. Hold the tarsal just below the ...
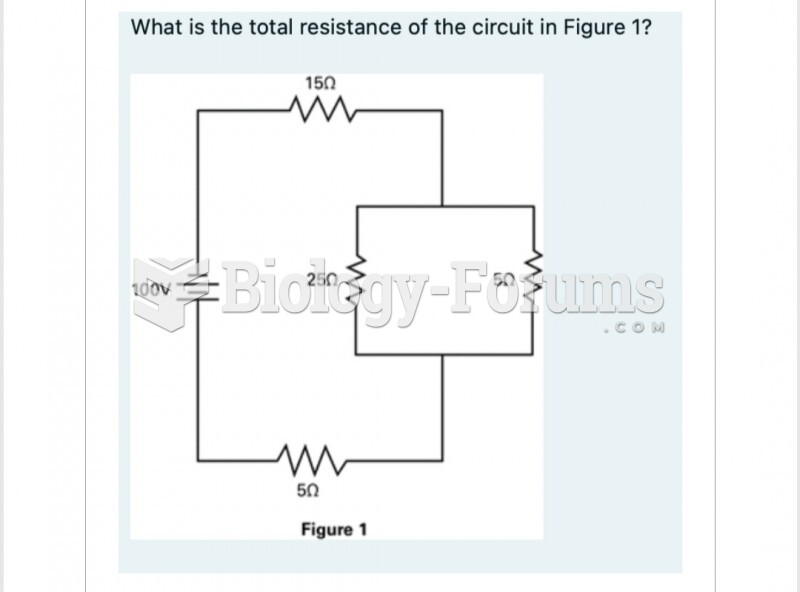 What is the total resistance of the circuit in Figure 1? 150
 Bayesian Analysis of the Genotype of II-2 in Figure A.4