|
|
|

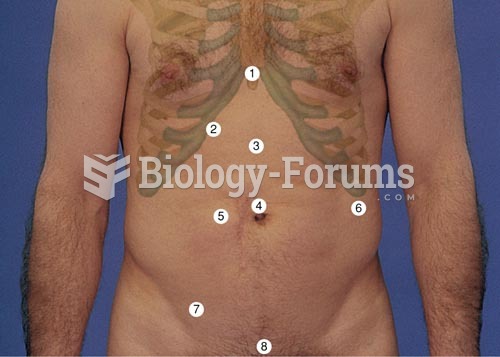 Abdominal Assessment Landmarks. When describing pathology of the abdomen, it is useful to use theses
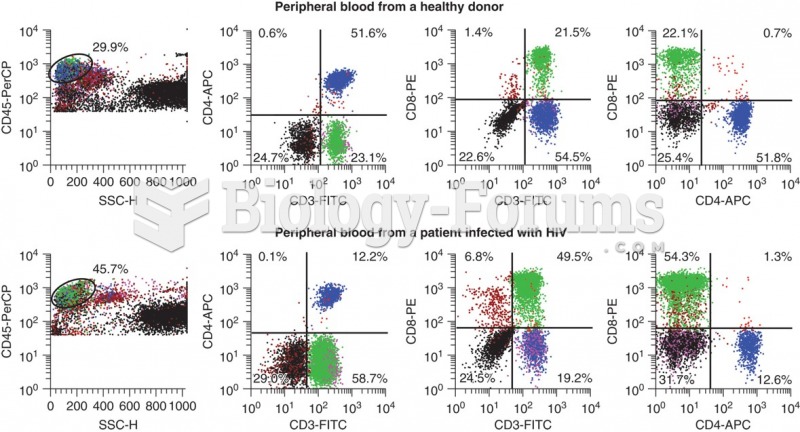 Flow cytometry data that shows the differences in CD3+ CD4+ cells that occur with HIV infection. ...
 Prepare knee for cold application. Undrape the leg. Check tissues visually and through palpation, ...
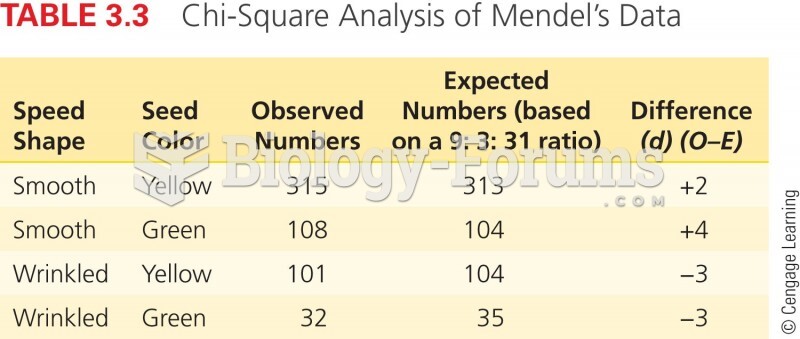 Chi-Square Analysis of Mendel's Data
 data
data
 Gamete genotype frequencies calculated from genetic linkage data