|
|
|

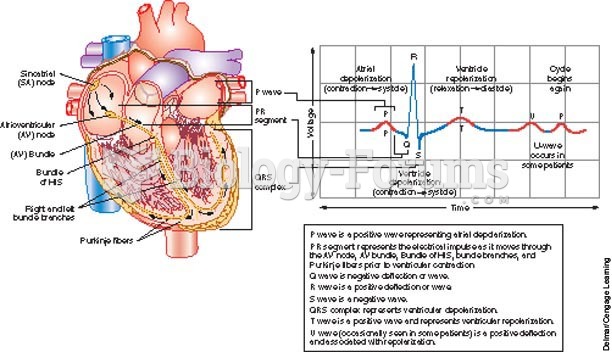 Relationship of the conduction system to an ECG strip.
 Chrysler Salon, N. Y. C., showing the 1937 Chrysler Airflow four-door sedan on display in the ...
 Ugonachomma display figure, Igbo, Nigeria.
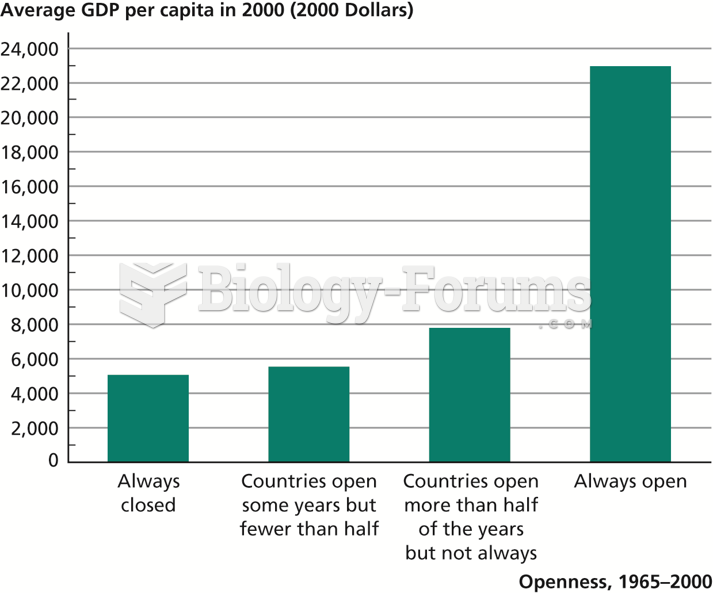 Relationship between Economic Openness and GDP per Capita
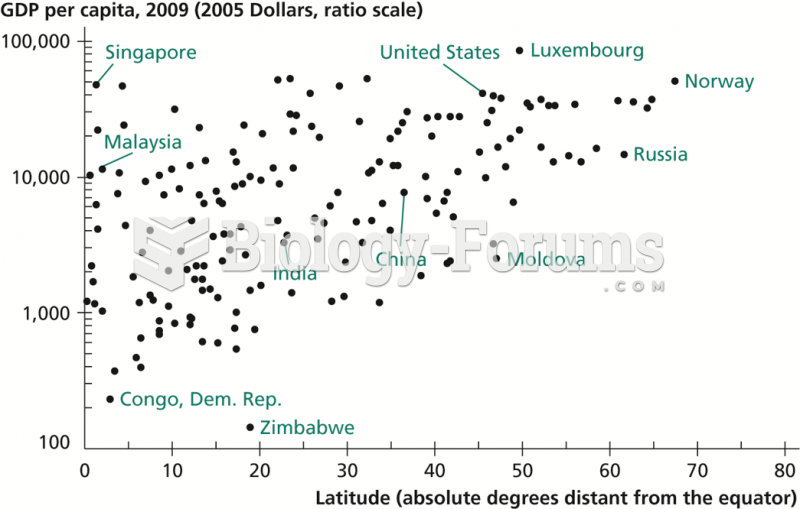 Relationship between Latitude and Income per Capita
 The colinear relationship