This topic contains a solution. Click here to go to the answer

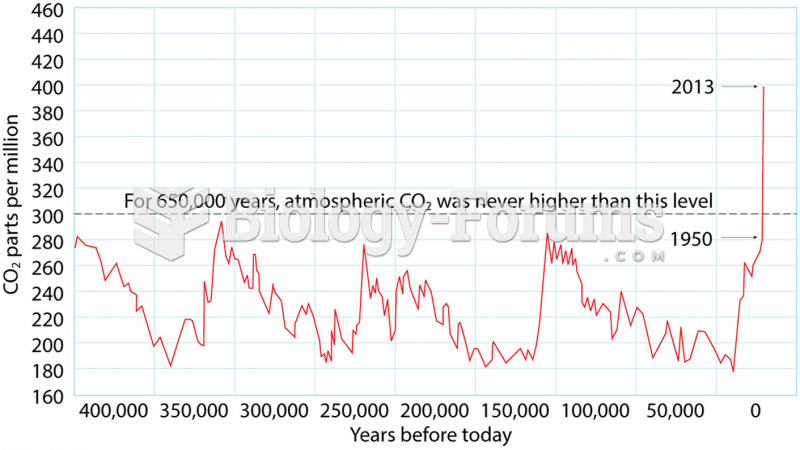
Author Question: The ________ is a graph which plots monthly averages of CO2 concentrations since 1958. A) Keeling ... (Read 42 times)

bclement10

  • Hero Member
  • *****
  • Posts: 560
The ________ is a graph which plots monthly averages of CO2 concentrations since 1958.
 
  A) Keeling Curve B) MCA C) Younger Dryas D) PETM

Question 2

Between 20 to 35 north latitude and 20 to 35 south latitude are
 
  A) warm and wet conditions, and the world's great tropical forests.
  B) the largest zone of water surpluses in the world.
  C) the world's largest arid and semi-arid desert regions.
  D) cyclonic systems of low pressure.


Related Topics

Need homework help now?

Ask unlimited questions for free

Ask a Question
Marked as best answer by a Subject Expert

pallen55

  • Sr. Member
  • ****
  • Posts: 331
Answer to Question 1

A

Answer to Question 2

C


bclement10

  • Member
  • Posts: 560
Reply 2 on: Jul 14, 2018
Gracias!


komodo7

  • Member
  • Posts: 322
Reply 3 on: Yesterday
YES! Correct, THANKS for helping me on my review


Did you know?

About 3.2 billion people, nearly half the world population, are at risk for malaria. In 2015, there are about 214 million malaria cases and an estimated 438,000 malaria deaths.

Did you know?

Pubic lice (crabs) are usually spread through sexual contact. You cannot catch them by using a public toilet.

Did you know?

People with high total cholesterol have about two times the risk for heart disease as people with ideal levels.

Did you know?

The people with the highest levels of LDL are Mexican American males and non-Hispanic black females.

Did you know?

Blastomycosis is often misdiagnosed, resulting in tragic outcomes. It is caused by a fungus living in moist soil, in wooded areas of the United States and Canada. If inhaled, the fungus can cause mild breathing problems that may worsen and cause serious illness and even death.

For a complete list of videos, visit our video library