This topic contains a solution. Click here to go to the answer
|
|
|

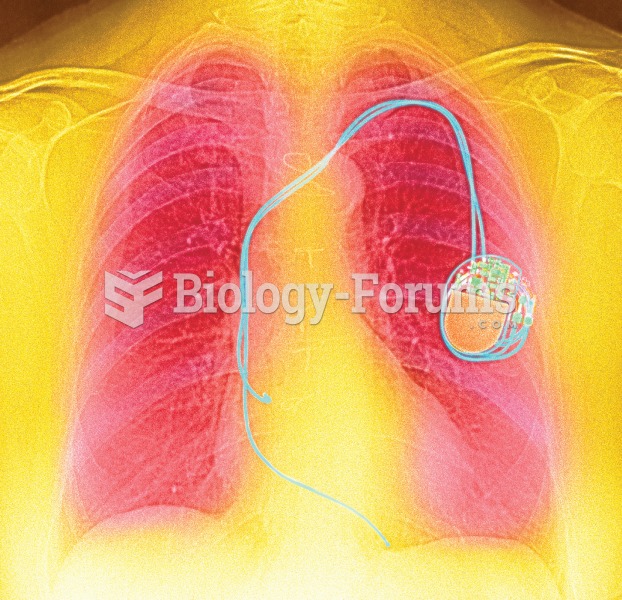 Color enhanced X-ray showing a pacemaker implanted in the left side of the chest and the electrode w
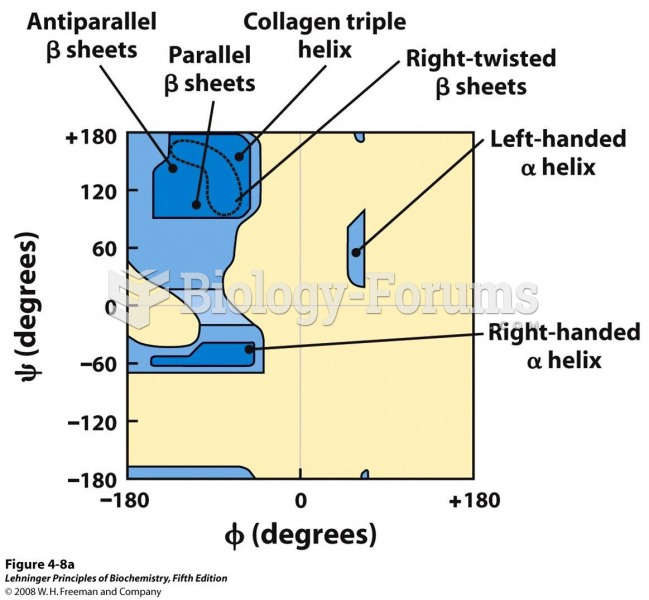 Ramachandran plots showing a variety of structures
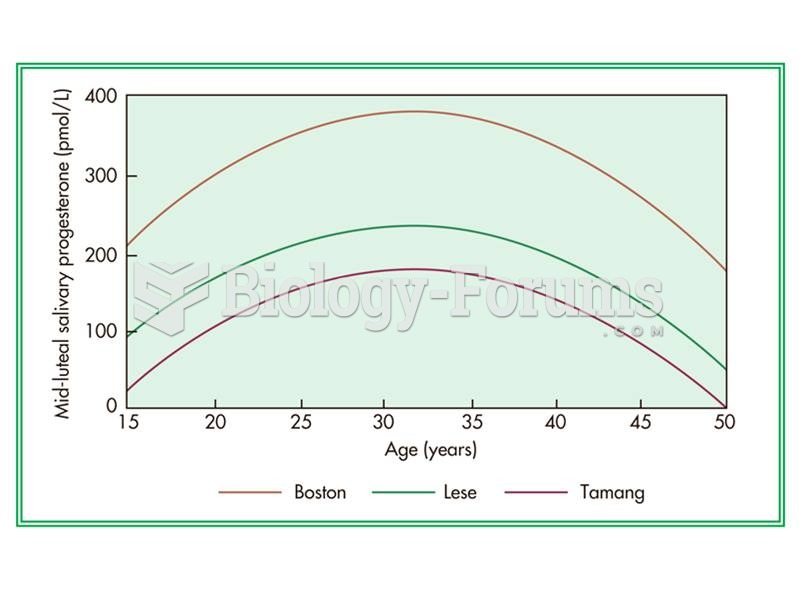 The age-dependent curve of salivary progresterone levels in three populations.
 With a fortune of $66 billion, Bill Gates, a cofounder of Microsoft Corporation, is the second ...
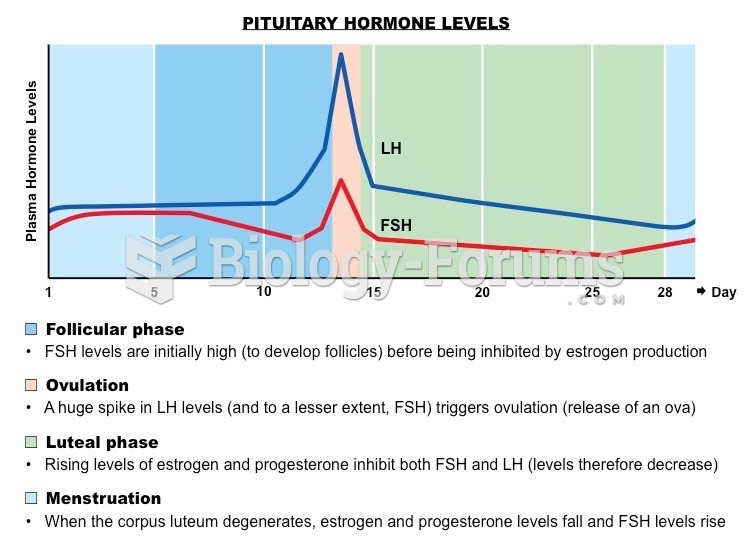 Pituitary Hormone Levels
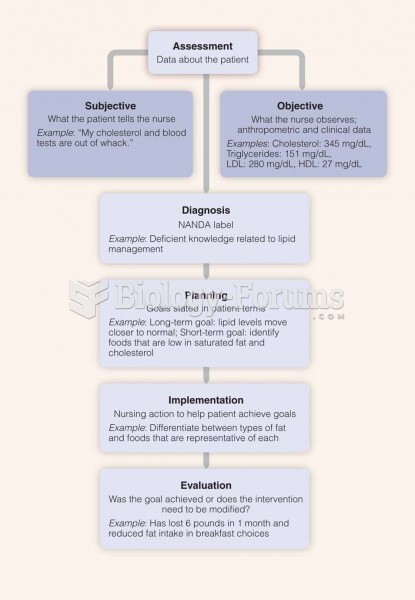 Nursing Care Plan Process: Client with High Blood Lipid Levels