|
|
|

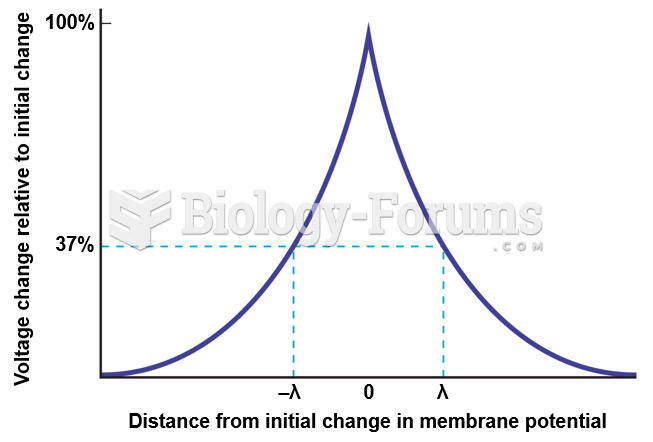 Distance from Initial Change in Membrane Potential vs. Voltage Change Relative to Initial Change
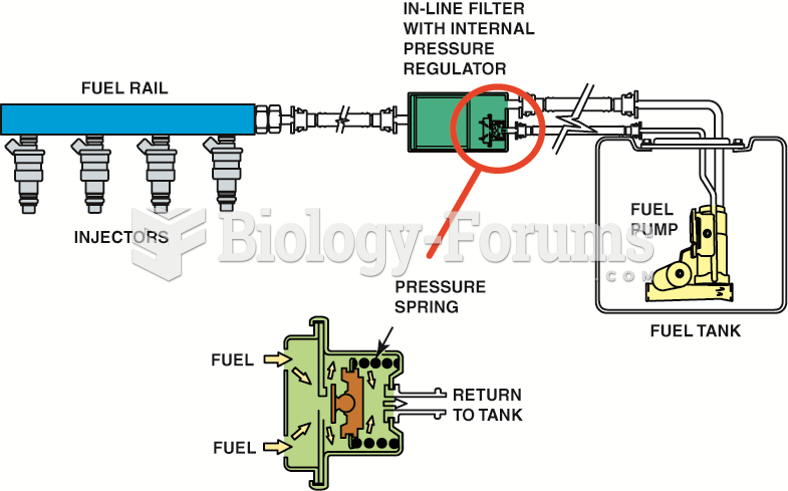 A mechanical returnless fuel system. The bypass regulator in the fuel tank controls fuel line ...
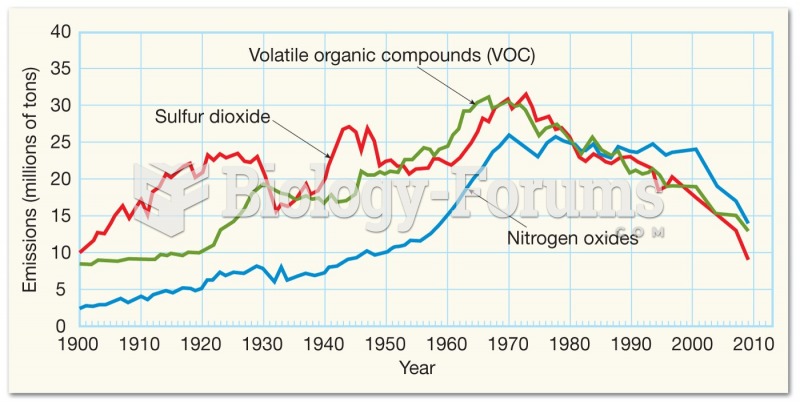 Trends in Air Quality
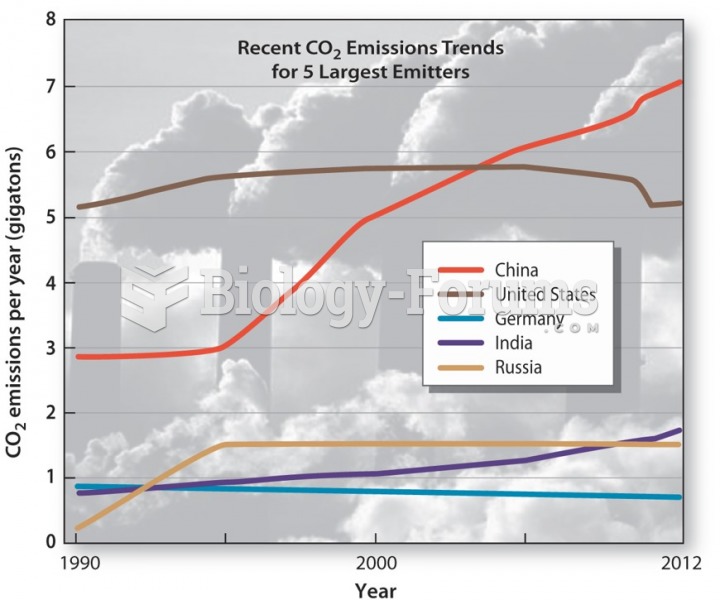 Global Warming: Trends and Tensions
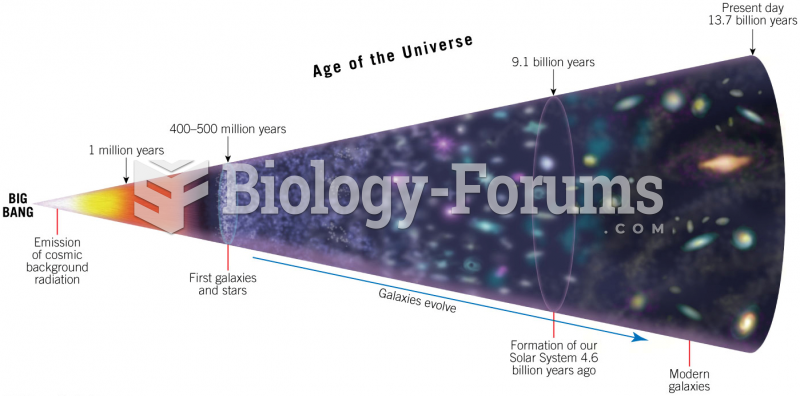 Time Line for Evolution of the Universe
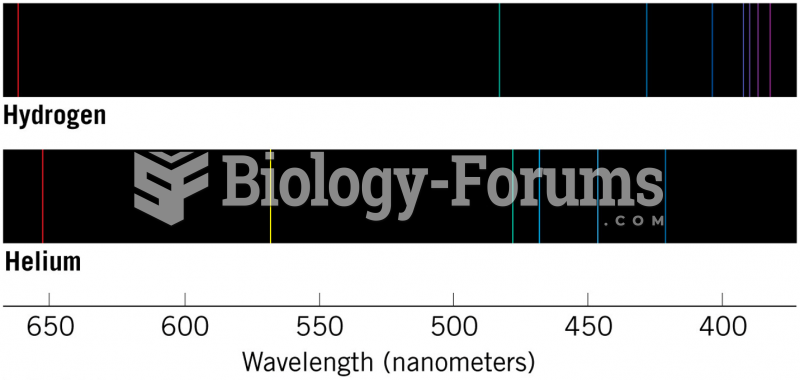 Bright-Line Spectra of Hydrogen and Helium