Visualize independently rising and falling lines that indicate NASDAQ per-share price of
stock for five competing companies on a monthly basis over the past ten years. What is the
term for this type of visual?
a. Bar chart
b. Organization chart
c. Flowchart
d. Graph
Question 2
Visualize a pie-shaped chart in which different-sized wedges indicate the percentage of
market share maintained by individual companies. What is the term for this type of visual?
a. Circle chart
b. Bar chart
c. Organization chart
d. Flowchart

 Mouse lung stained to visualize differentiated epithelial cells and macrophages
 Some Alleles Do Not Assort Independently (Part 2)
 Wassily Kandinsky, Black Lines (Schwarze Linien).
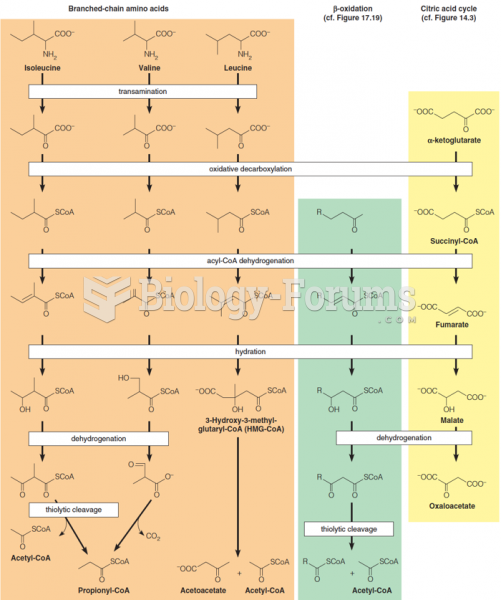 Branched-chain amino acid oxidation, fatty acid b-oxidation, and the citric acid cycle share a commo
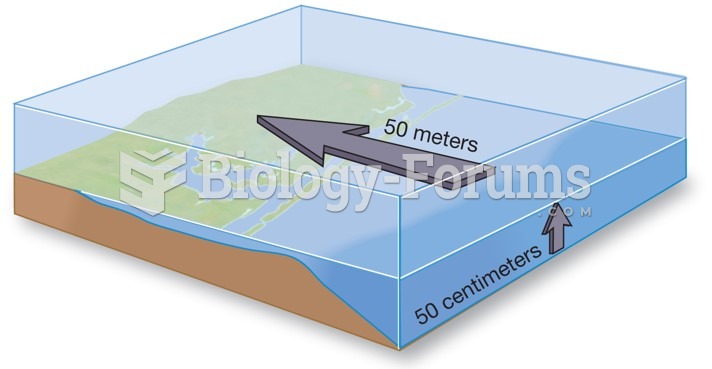 Impacts of rising sea level
 ADHD (Stock photo)