This topic contains a solution. Click here to go to the answer
|
|
|

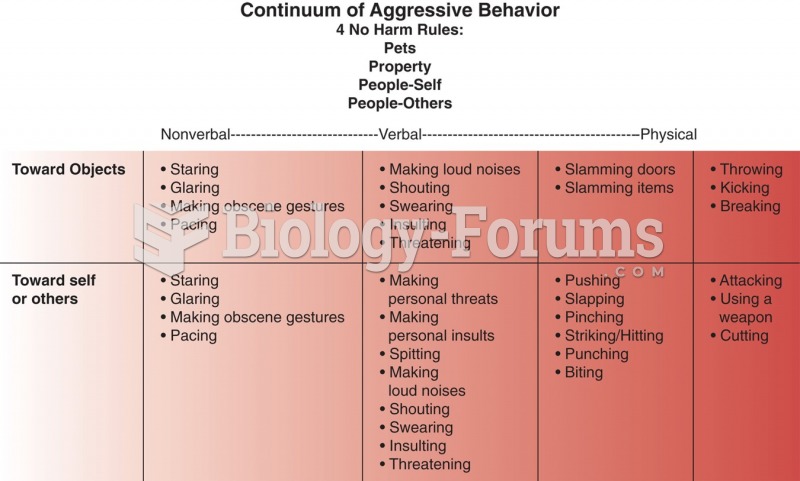 Continuum of aggression. Based on an unpublished figure by Joanne DeSanto Iennaco.
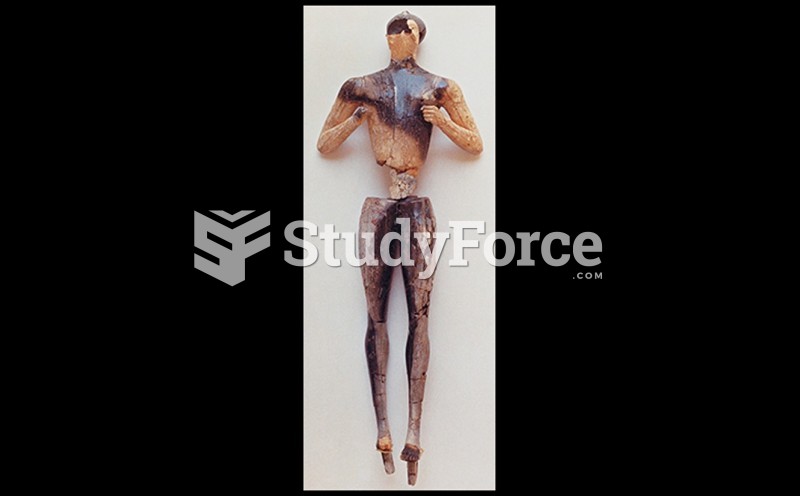 Statuette of a Male Figure
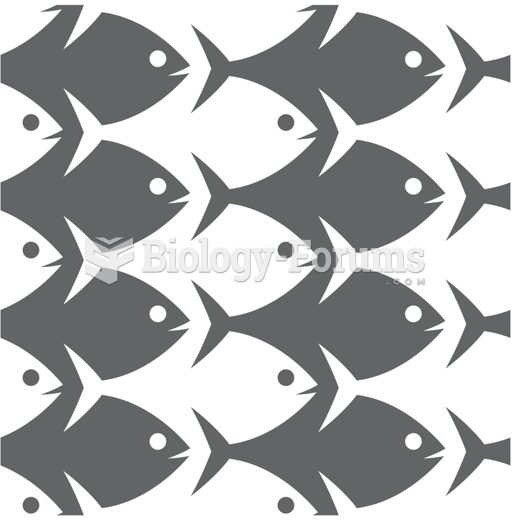 Figure and Ground
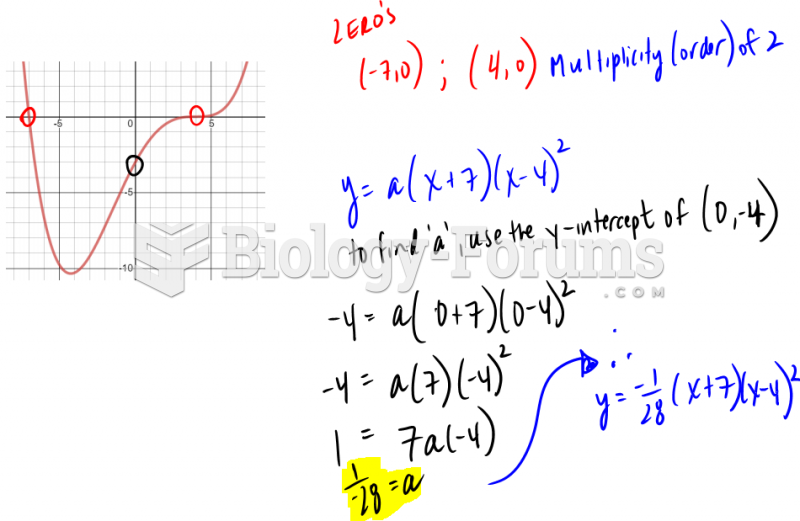 Converting cubic graph to function
 Picture graph
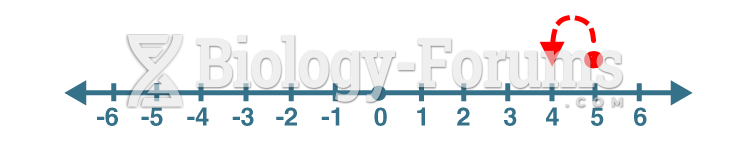 Number line (5 - 1)