When plotting correlational data, the appropriate graph to use is the
a. line graph. c. histogram.
b. bar graph. d. scatterplot.
Question 2
We should do a scatterplot of the data when we compute a correlation because the scatterplot allows us to
a. see the relationship between the two variables.
b. determine the exact value of the correlation coefficient.
c. determine whether a relationship is likely to exist in the population from which the sample is taken.
d. predict accurate Y scores for known X scores.

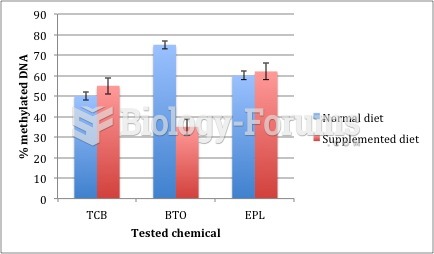 Graph of 3 compounds tested
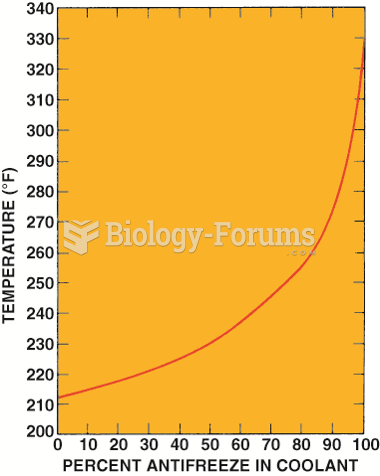 Graph showing how the boiling point of the coolant increases as the percentage of antifreeze in ...
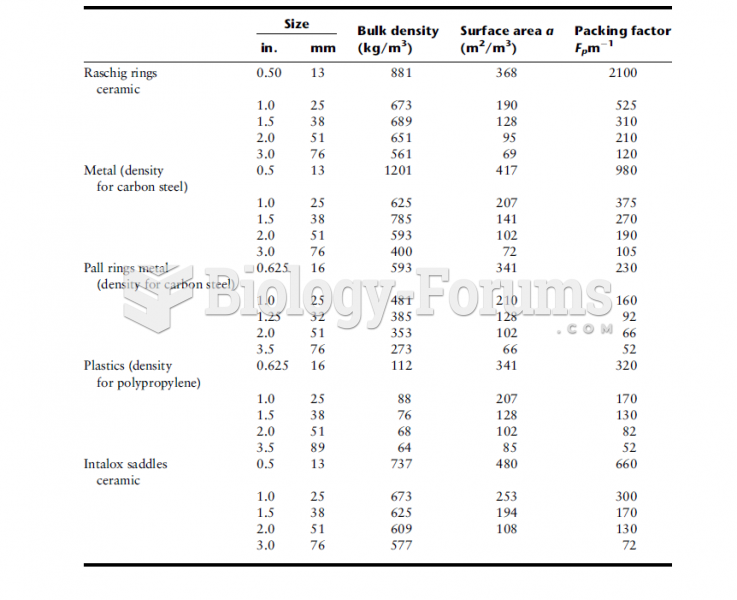 Design Data for Various Packings
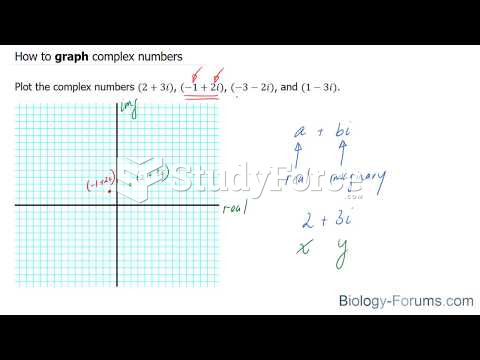 How to graph complex numbers
 Graph the function by hand & label key points on graph:
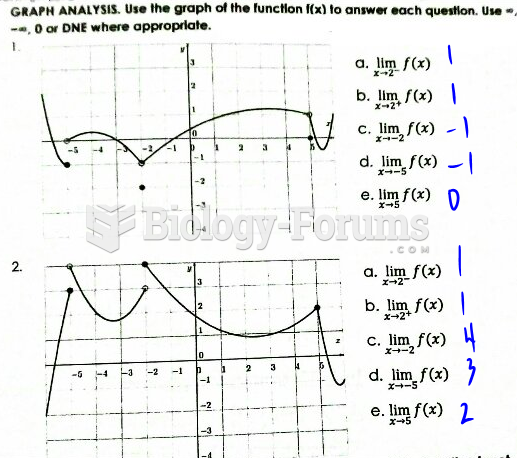 Use the graph of the function f(x) to answer each question.