This topic contains a solution. Click here to go to the answer
|
|
|

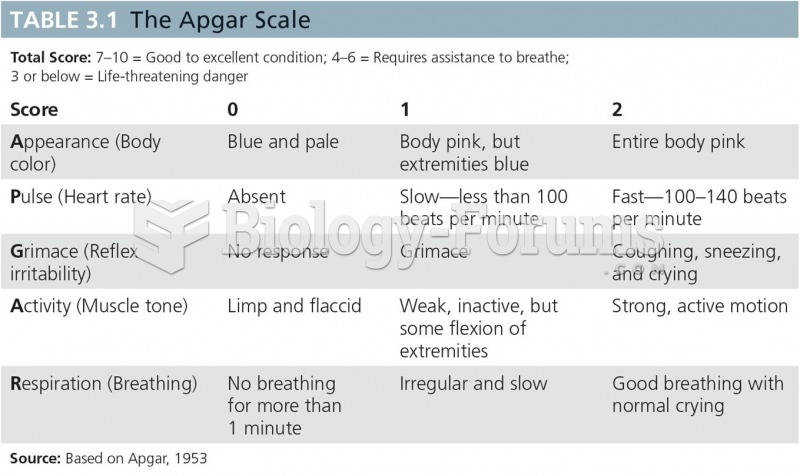 The Apgar Scale
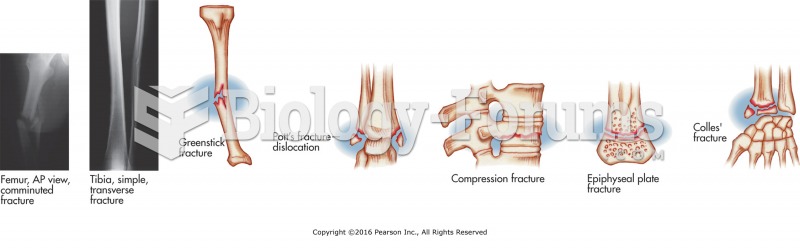 Types of fractures. Massage is contraindicated near fractures in early stages of healing.
 Types of Policies Important for a Massage Therapy Practice
 How to create a frequency table and histogram from raw data
 Measuring the client’s weight with a standard platform scale
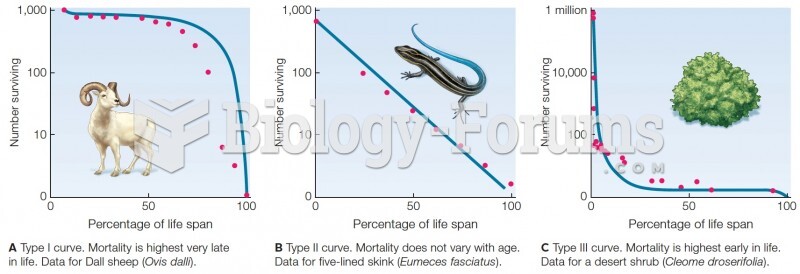 Survivorship curves. Blue lines are theoretical curves. Red dots are data from field studies.