|
|
|

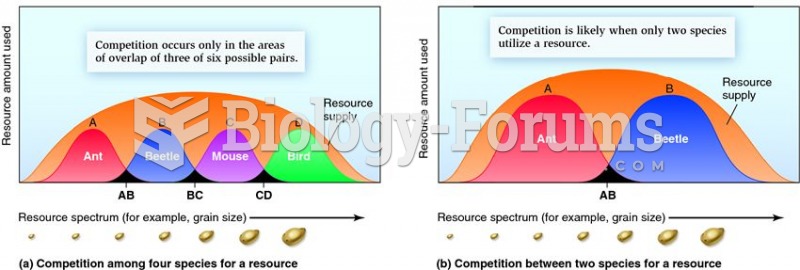 The frequency of competition according to the number of species involved.
 Styloid process
 The process of learning to read involves physical and socioemotional development, changes in the ...
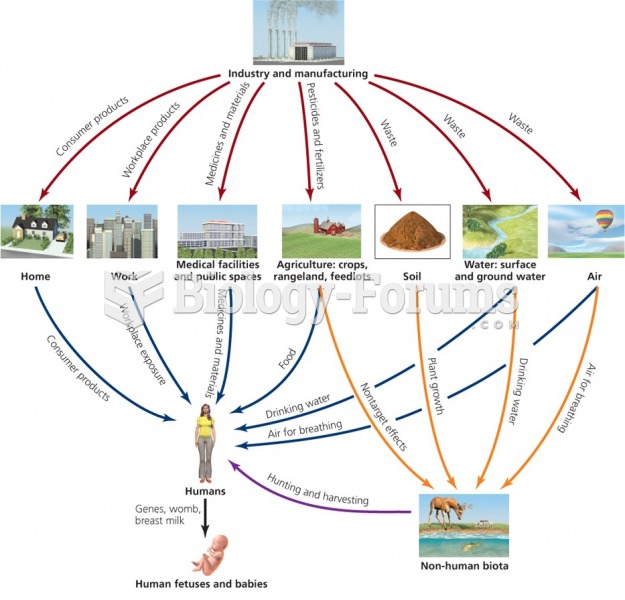 The impact of industry and manufacturing on our life
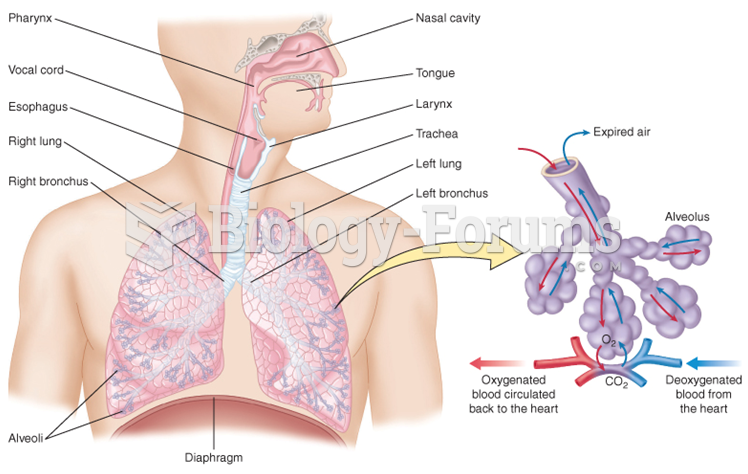 The respiratory system and the process of gas exchange
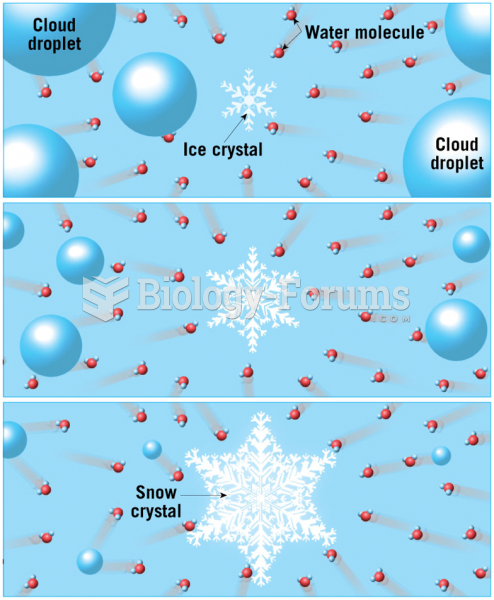 The Bergeron Process