This topic contains a solution. Click here to go to the answer
|
|
|

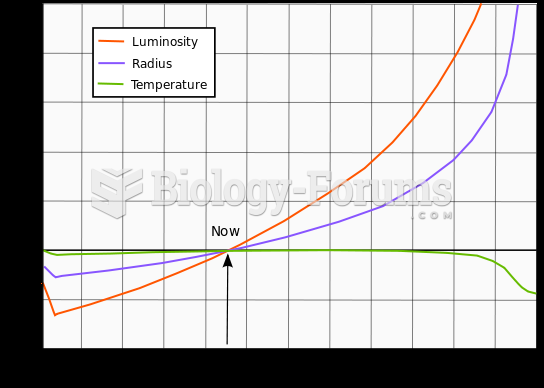 Evolution of the Sun's luminosity, radius and effective temperature compared to the present Sun
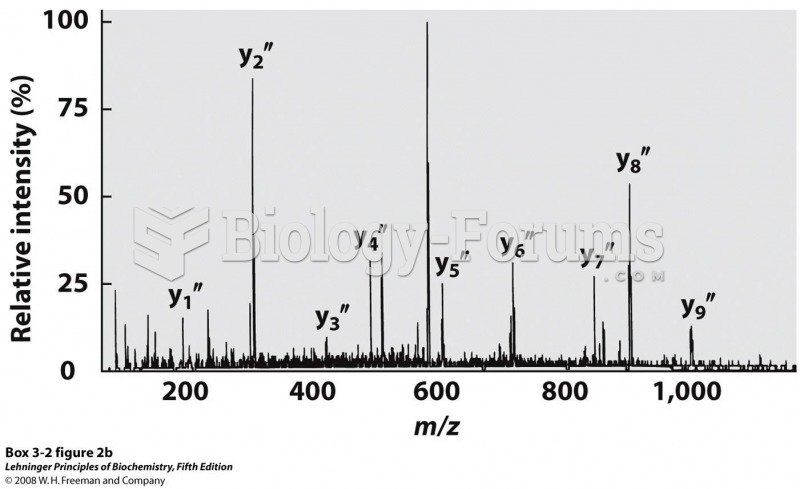 A typical spectrum with peaks representing the peptide fragments generated from a sample
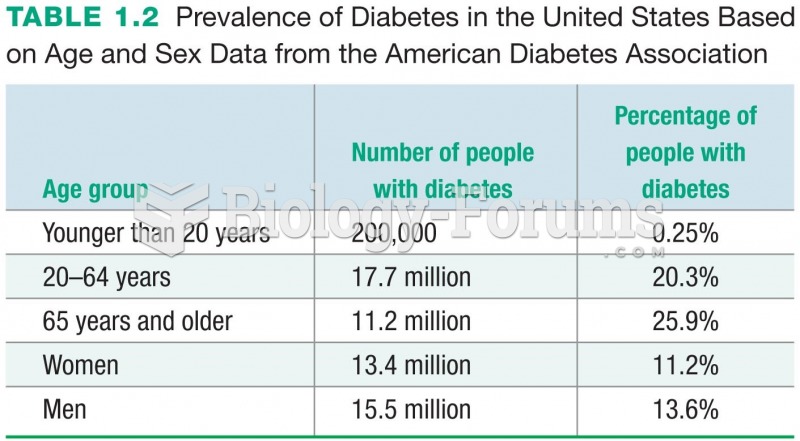 Prevalence of Diabetes in the United States Based on Age and Sex Data from the American Diabetes ...
 Sample tiered drug formulary for antibiotics.
 How to solve rate problems leading to fractional equations (Question 3)
 Discrete random variables- Probability Distribution Function